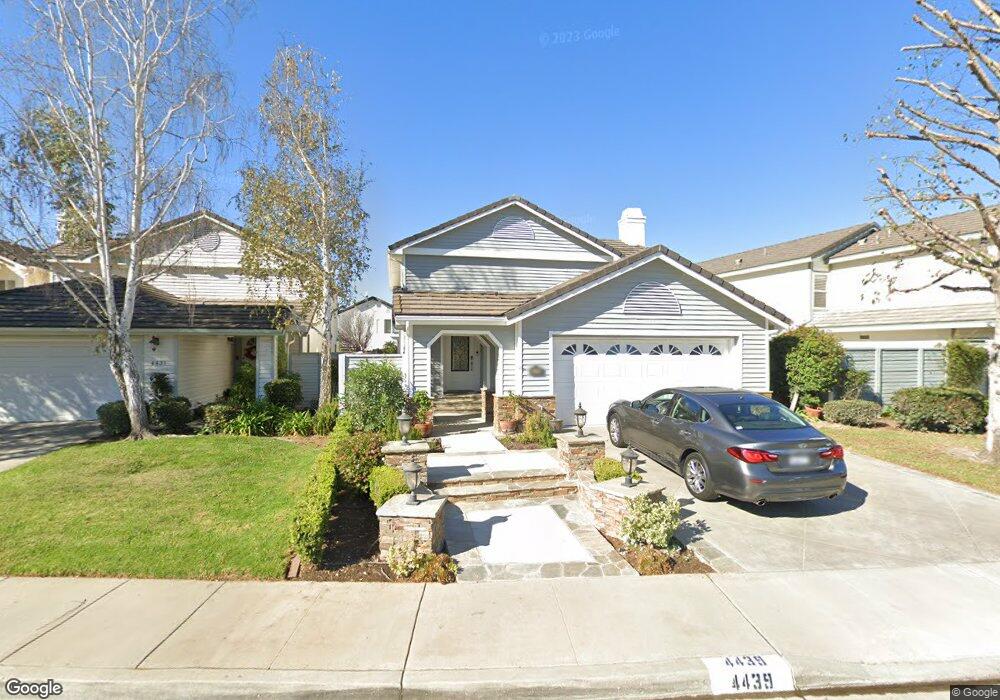
4439 Honeyglen Ct Moorpark, CA 93021
Estimated Value: $901,000 - $928,000
3
Beds
3
Baths
1,803
Sq Ft
$508/Sq Ft
Est. Value
About This Home
This home is located at 4439 Honeyglen Ct, Moorpark, CA 93021 and is currently estimated at $916,499, approximately $508 per square foot. 4439 Honeyglen Ct is a home located in Ventura County with nearby schools including Mountain Meadows Elementary School, Chaparral Middle School, and Moorpark High School.
Ownership History
Date
Name
Owned For
Owner Type
Purchase Details
Closed on
Nov 5, 2015
Sold by
Ryan Joseph J and Rivezzo Milli
Bought by
Ryan Joseph James and Ryan Milli Rivezzo
Current Estimated Value
Purchase Details
Closed on
Aug 24, 2011
Sold by
Rivezzo Mildred
Bought by
Ryan Joseph James and Rivezzo Milli
Purchase Details
Closed on
Mar 12, 2003
Sold by
Rivezzo Mildred and Rivezzo Peter J
Bought by
Rivezzo Mildred
Home Financials for this Owner
Home Financials are based on the most recent Mortgage that was taken out on this home.
Original Mortgage
$254,000
Interest Rate
5.82%
Purchase Details
Closed on
Jul 24, 1998
Sold by
Mildred Rivezzo
Bought by
Rivezzo Peter J and Rivezzo Mildred
Purchase Details
Closed on
Jun 24, 1994
Sold by
White Donald W and White Karen M
Bought by
Rivezzo Mildred
Home Financials for this Owner
Home Financials are based on the most recent Mortgage that was taken out on this home.
Original Mortgage
$184,250
Interest Rate
8.57%
Create a Home Valuation Report for This Property
The Home Valuation Report is an in-depth analysis detailing your home's value as well as a comparison with similar homes in the area
Home Values in the Area
Average Home Value in this Area
Purchase History
| Date | Buyer | Sale Price | Title Company |
|---|---|---|---|
| Ryan Joseph James | -- | None Available | |
| Ryan Joseph James | -- | Accommodation | |
| Rivezzo Mildred | -- | Chicago Title | |
| Rivezzo Peter J | -- | Old Republic Title Company | |
| Rivezzo Mildred | $205,000 | Fidelity National Title | |
| Rivezzo Mildred | -- | Fidelity National Title |
Source: Public Records
Mortgage History
| Date | Status | Borrower | Loan Amount |
|---|---|---|---|
| Closed | Rivezzo Mildred | $254,000 | |
| Closed | Rivezzo Mildred | $184,250 |
Source: Public Records
Tax History Compared to Growth
Tax History
| Year | Tax Paid | Tax Assessment Tax Assessment Total Assessment is a certain percentage of the fair market value that is determined by local assessors to be the total taxable value of land and additions on the property. | Land | Improvement |
|---|---|---|---|---|
| 2025 | $4,185 | $386,188 | $137,701 | $248,487 |
| 2024 | $4,185 | $378,616 | $135,001 | $243,615 |
| 2023 | $4,092 | $371,193 | $132,354 | $238,839 |
| 2022 | $3,987 | $363,915 | $129,759 | $234,156 |
| 2021 | $3,978 | $356,780 | $127,215 | $229,565 |
| 2020 | $3,940 | $353,123 | $125,911 | $227,212 |
| 2019 | $3,798 | $341,079 | $123,443 | $217,636 |
| 2018 | $3,758 | $334,392 | $121,023 | $213,369 |
| 2017 | $3,680 | $327,836 | $118,650 | $209,186 |
| 2016 | $3,611 | $321,409 | $116,324 | $205,085 |
| 2015 | $3,561 | $316,583 | $114,578 | $202,005 |
| 2014 | $3,481 | $310,384 | $112,335 | $198,049 |
Source: Public Records
Map
Nearby Homes
- 4429 Summerglen Ct
- 4471 Skyglen Ct
- 4833 E Beltramo Ranch Rd
- 4819 E Beltramo Ranch Rd
- 4827 E Beltramo Ranch Rd
- 4744 Elderberry Ave
- 12490 Spring Creek Rd
- 4741 Justin Ct
- 4304 Timberdale Rd
- 4196 Hillbrook Ct
- 11860 Alderbrook St
- 12441 Beech Grove Ct
- 4844 Arroyo Run
- 4820 Arroyo Run
- Plan 2428 Modeled at The Bungalows at Beltramo
- Plan 2288 Modeled at The Bungalows at Beltramo
- Plan 1908 at The Bungalows at Beltramo
- 4007 Doneva Rd
- 12026 Haven Crest St
- 11544 Treeview Ct
- 4431 Honeyglen Ct
- 4447 Honeyglen Ct
- 4419 Honeyglen Ct
- 4455 Honeyglen Ct
- 4438 Summerglen Ct
- 4446 Summerglen Ct
- 4411 Honeyglen Ct
- 4430 Summerglen Ct
- 4454 Summerglen Ct
- 4467 Honeyglen Ct
- 4418 Summerglen Ct
- 4420 Honeyglen Ct
- 4440 Honeyglen Ct
- 4403 Honeyglen Ct
- 4412 Honeyglen Ct
- 4448 Honeyglen Ct
- 4410 Summerglen Ct
- 4404 Honeyglen Ct
- 4456 Honeyglen Ct
- 4475 Honeyglen Ct