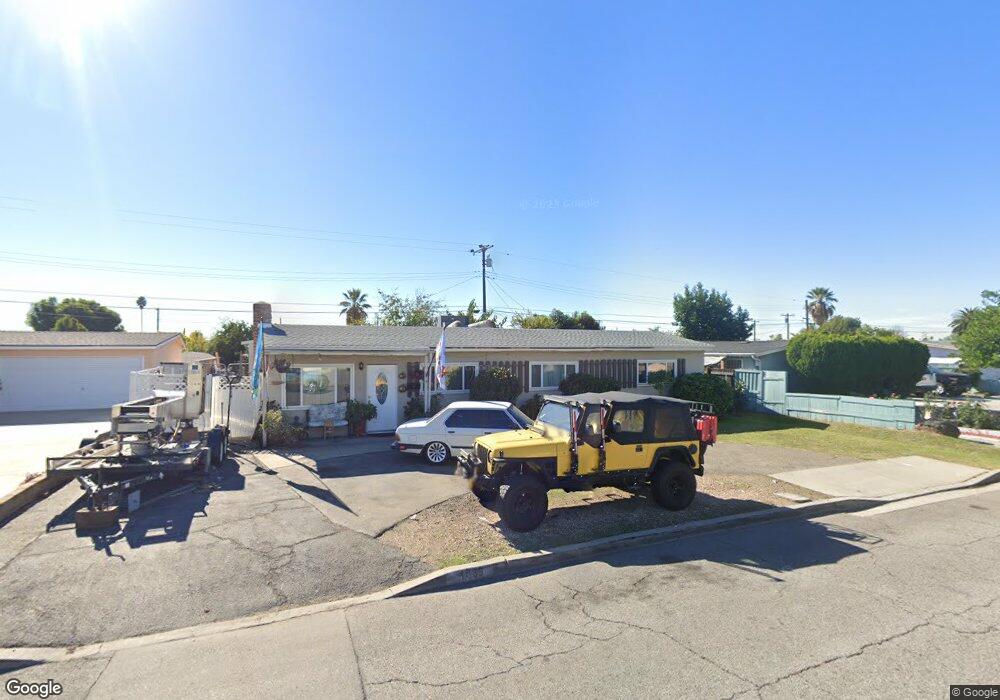
4439 Princeton St Montclair, CA 91763
Estimated Value: $655,000 - $746,000
4
Beds
2
Baths
1,325
Sq Ft
$528/Sq Ft
Est. Value
About This Home
This home is located at 4439 Princeton St, Montclair, CA 91763 and is currently estimated at $699,976, approximately $528 per square foot. 4439 Princeton St is a home located in San Bernardino County with nearby schools including Lehigh Elementary School, Serrano Middle School, and Montclair High School.
Ownership History
Date
Name
Owned For
Owner Type
Purchase Details
Closed on
Apr 13, 2016
Sold by
Hernandez June
Bought by
Hernandez April
Current Estimated Value
Home Financials for this Owner
Home Financials are based on the most recent Mortgage that was taken out on this home.
Original Mortgage
$264,000
Outstanding Balance
$209,732
Interest Rate
3.68%
Mortgage Type
New Conventional
Estimated Equity
$490,244
Purchase Details
Closed on
May 6, 2009
Sold by
Derrick Donna M
Bought by
Hernandez June and Hernandez April
Purchase Details
Closed on
Apr 9, 2009
Sold by
Villasenor Danny
Bought by
Hernandez June and Hernandez April
Purchase Details
Closed on
Apr 1, 2008
Sold by
Derrick Donna M
Bought by
Villasenor Danny and Ramos Michelle
Home Financials for this Owner
Home Financials are based on the most recent Mortgage that was taken out on this home.
Original Mortgage
$280,596
Interest Rate
6.04%
Mortgage Type
FHA
Purchase Details
Closed on
Feb 20, 1996
Sold by
Novak Lawrence L
Bought by
Novak Lawrence L
Create a Home Valuation Report for This Property
The Home Valuation Report is an in-depth analysis detailing your home's value as well as a comparison with similar homes in the area
Home Values in the Area
Average Home Value in this Area
Purchase History
| Date | Buyer | Sale Price | Title Company |
|---|---|---|---|
| Hernandez April | -- | First American Title Company | |
| Hernandez June | $285,000 | First American Title | |
| Hernandez June | -- | First American Title | |
| Villasenor Danny | $285,000 | Orange Coast Title | |
| Novak Lawrence L | -- | -- |
Source: Public Records
Mortgage History
| Date | Status | Borrower | Loan Amount |
|---|---|---|---|
| Open | Hernandez April | $264,000 | |
| Previous Owner | Villasenor Danny | $280,596 |
Source: Public Records
Tax History Compared to Growth
Tax History
| Year | Tax Paid | Tax Assessment Tax Assessment Total Assessment is a certain percentage of the fair market value that is determined by local assessors to be the total taxable value of land and additions on the property. | Land | Improvement |
|---|---|---|---|---|
| 2025 | $5,472 | $388,424 | $136,704 | $251,720 |
| 2024 | $5,472 | $380,808 | $134,024 | $246,784 |
| 2023 | $5,354 | $373,341 | $131,396 | $241,945 |
| 2022 | $5,301 | $366,021 | $128,820 | $237,201 |
| 2021 | $5,276 | $358,844 | $126,294 | $232,550 |
| 2020 | $5,206 | $355,164 | $124,999 | $230,165 |
| 2019 | $5,173 | $348,200 | $122,548 | $225,652 |
| 2018 | $5,119 | $341,372 | $120,145 | $221,227 |
| 2017 | $4,942 | $334,678 | $117,789 | $216,889 |
| 2016 | $4,639 | $316,232 | $110,959 | $205,273 |
| 2015 | $3,393 | $311,482 | $109,292 | $202,190 |
| 2014 | $3,287 | $305,380 | $107,151 | $198,229 |
Source: Public Records
Map
Nearby Homes
- 9733 Mills Ave
- 126 Bryn Mawr Rd
- 646 Sycamore Ave Unit 18
- 9642 Bolton Ave
- 4552 La Deney St
- 9811 Bolton Ave
- 4528 El Morado St
- 4424 San Jose St Unit 3
- 9382 Shadowood Dr
- 9617 Greenwood Ave
- 1724 Fellows Place
- 509 Cedar Crest Ave
- 1748 Bonnie Brae St
- 9386 Mesa Verde Dr Unit B
- 1565 Ledgestone Ln
- 10593 Mills Ave
- 1760 Cordova St
- 4219 Fauna St
- 10199 Camulos Ave
- 1989 Annandale Way
- 4429 Princeton St
- 4449 Princeton St
- 4440 Harvard St
- 4430 Harvard St
- 4450 Harvard St
- 4459 Princeton St
- 4417 Princeton St
- 4438 Princeton St
- 4448 Princeton St
- 4418 Harvard St
- 4460 Harvard St
- 4426 Princeton St
- 4458 Princeton St
- 4409 Princeton St
- 4467 Princeton St
- 4408 Harvard St
- 4468 Harvard St
- 4468 Princeton St
- 4437 Harvard St
- 4477 Princeton St