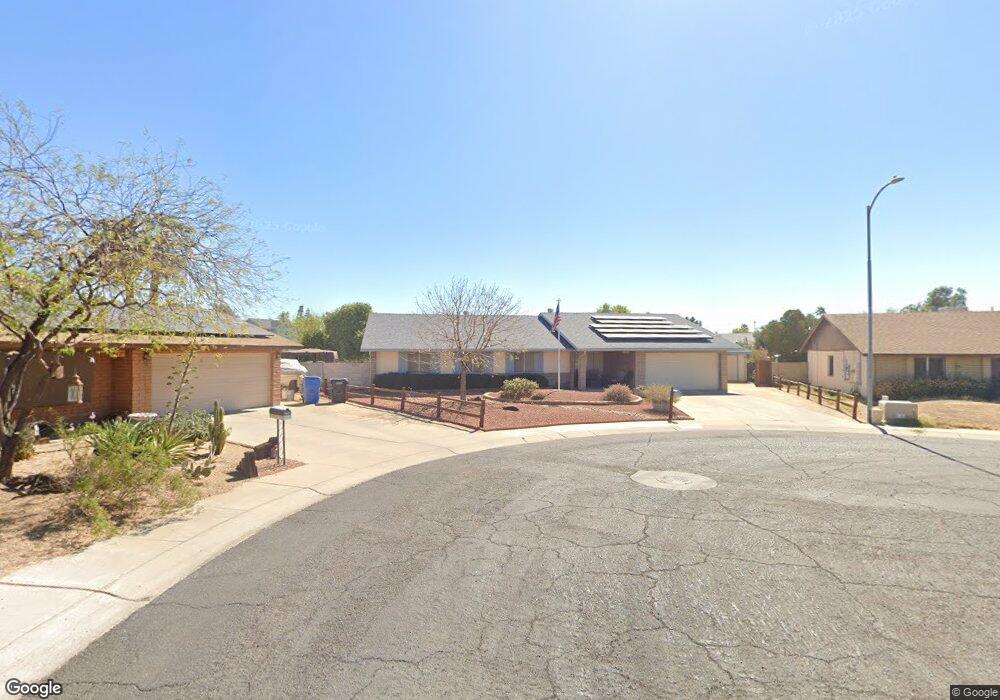
4439 W Charter Oak Rd Glendale, AZ 85304
North Mountain Village NeighborhoodEstimated Value: $417,681 - $482,000
--
Bed
2
Baths
2,076
Sq Ft
$221/Sq Ft
Est. Value
About This Home
This home is located at 4439 W Charter Oak Rd, Glendale, AZ 85304 and is currently estimated at $458,170, approximately $220 per square foot. 4439 W Charter Oak Rd is a home located in Maricopa County with nearby schools including Sweetwater School, Moon Valley High School, and Emmaus Lutheran School.
Ownership History
Date
Name
Owned For
Owner Type
Purchase Details
Closed on
Feb 24, 2017
Sold by
Nielsen Harold D and Nielsen Marget J
Bought by
Nielsen Margaret J
Current Estimated Value
Purchase Details
Closed on
Mar 25, 2016
Sold by
Nielsen Margaret J and Wood Margaret D
Bought by
Nielsen Margaret J
Purchase Details
Closed on
Jan 6, 2000
Sold by
Fagen Floyd A and Fagen Marcia L
Bought by
Nielsen Harold D and Nielsen Margaret J
Home Financials for this Owner
Home Financials are based on the most recent Mortgage that was taken out on this home.
Original Mortgage
$130,000
Interest Rate
8.16%
Mortgage Type
New Conventional
Purchase Details
Closed on
Jul 21, 1998
Sold by
Handzel James M and Handzel Sharon C
Bought by
Fagen Floyd A and Fagen Marcia L
Home Financials for this Owner
Home Financials are based on the most recent Mortgage that was taken out on this home.
Original Mortgage
$65,000
Interest Rate
6.95%
Mortgage Type
New Conventional
Create a Home Valuation Report for This Property
The Home Valuation Report is an in-depth analysis detailing your home's value as well as a comparison with similar homes in the area
Home Values in the Area
Average Home Value in this Area
Purchase History
| Date | Buyer | Sale Price | Title Company |
|---|---|---|---|
| Nielsen Margaret J | -- | Old Republic Title Agency | |
| Nielsen Margaret J | -- | None Available | |
| Nielsen Harold D | $140,000 | Capital Title Agency | |
| Fagen Floyd A | $131,900 | -- |
Source: Public Records
Mortgage History
| Date | Status | Borrower | Loan Amount |
|---|---|---|---|
| Previous Owner | Nielsen Harold D | $130,000 | |
| Previous Owner | Fagen Floyd A | $65,000 |
Source: Public Records
Tax History Compared to Growth
Tax History
| Year | Tax Paid | Tax Assessment Tax Assessment Total Assessment is a certain percentage of the fair market value that is determined by local assessors to be the total taxable value of land and additions on the property. | Land | Improvement |
|---|---|---|---|---|
| 2025 | $2,131 | $19,886 | -- | -- |
| 2024 | $2,089 | $18,939 | -- | -- |
| 2023 | $2,089 | $36,480 | $7,290 | $29,190 |
| 2022 | $2,016 | $28,310 | $5,660 | $22,650 |
| 2021 | $2,067 | $26,160 | $5,230 | $20,930 |
| 2020 | $2,011 | $24,270 | $4,850 | $19,420 |
| 2019 | $1,974 | $23,720 | $4,740 | $18,980 |
| 2018 | $1,919 | $21,980 | $4,390 | $17,590 |
| 2017 | $1,913 | $18,710 | $3,740 | $14,970 |
| 2016 | $1,879 | $18,230 | $3,640 | $14,590 |
| 2015 | $1,743 | $17,700 | $3,540 | $14,160 |
Source: Public Records
Map
Nearby Homes
- 4453 W Wethersfield Rd
- 4530 W Paradise Dr
- 4329 W Bloomfield Rd
- 4632 W Paradise Dr Unit 7
- 12225 N 47th Dr
- 4554 W Sunnyside Ave
- 4643 W Laurel Ln
- 4740 W Bloomfield Rd
- 4501 W Altadena Ave Unit 6
- 12205 N 41st Ln
- 4235 W Aster Dr
- 4743 W Shaw Butte Dr
- 12018 N 41st Ave
- 4127 W Paradise Dr
- 4425 W Sierra St
- 4114 W Sunnyside Ave
- 4162 W Sierra St
- 4747 W Sunnyside Ave
- 3935 W Charter Oak Rd
- 3930 W Desert Hills Dr
- 4431 W Charter Oak Rd
- 4447 W Charter Oak Rd
- 4438 W Wethersfield Rd
- 4446 W Wethersfield Rd
- 4432 W Charter Oak Rd
- 12351 N 44th Dr
- 12331 N 44th Dr
- 4453 W Charter Oak Rd
- 12341 N 44th Dr
- 4438 W Charter Oak Rd
- 4430 W Charter Oak Rd
- 4452 W Wethersfield Rd
- 12325 N 44th Dr
- 4446 W Charter Oak Rd
- 12349 N 44th Dr
- 12333 N 44th Dr
- 12339 N 44th Dr
- 12343 N 44th Dr
- 4424 W Charter Oak Rd
- 4428 W Charter Oak Rd