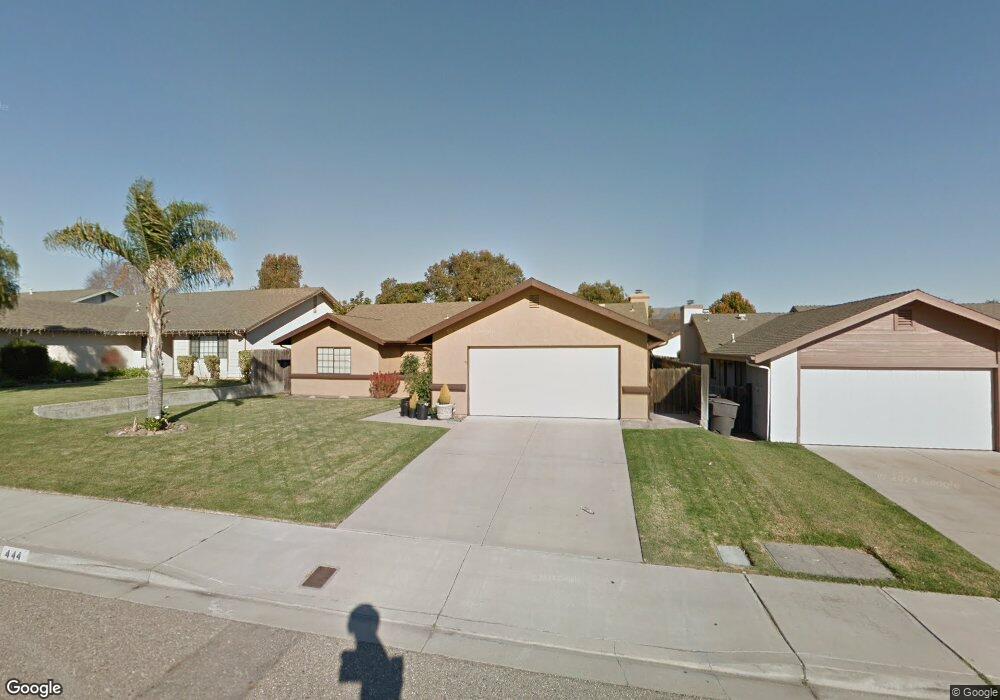
444 Alegre Ave Nipomo, CA 93444
Estimated Value: $712,178 - $755,000
3
Beds
2
Baths
1,600
Sq Ft
$464/Sq Ft
Est. Value
About This Home
This home is located at 444 Alegre Ave, Nipomo, CA 93444 and is currently estimated at $742,295, approximately $463 per square foot. 444 Alegre Ave is a home located in San Luis Obispo County with nearby schools including Dana Elementary School, Mesa Middle School, and Nipomo High School.
Ownership History
Date
Name
Owned For
Owner Type
Purchase Details
Closed on
Mar 26, 2003
Sold by
Alcantar Carlos A and Alcantar Imelda R
Bought by
Alcantar Carlos A and Alcantar Imelda R
Current Estimated Value
Home Financials for this Owner
Home Financials are based on the most recent Mortgage that was taken out on this home.
Original Mortgage
$185,000
Outstanding Balance
$79,008
Interest Rate
5.79%
Estimated Equity
$663,287
Purchase Details
Closed on
Mar 5, 1997
Sold by
Desande Frank B and Desande Nina V
Bought by
Alcantar Carlos A and Alcantar Imelda R
Home Financials for this Owner
Home Financials are based on the most recent Mortgage that was taken out on this home.
Original Mortgage
$117,045
Interest Rate
7.86%
Mortgage Type
FHA
Create a Home Valuation Report for This Property
The Home Valuation Report is an in-depth analysis detailing your home's value as well as a comparison with similar homes in the area
Home Values in the Area
Average Home Value in this Area
Purchase History
| Date | Buyer | Sale Price | Title Company |
|---|---|---|---|
| Alcantar Carlos A | $92,500 | First American Title Company | |
| Alcantar Carlos A | $147,000 | Fidelity National Title Co |
Source: Public Records
Mortgage History
| Date | Status | Borrower | Loan Amount |
|---|---|---|---|
| Open | Alcantar Carlos A | $185,000 | |
| Closed | Alcantar Carlos A | $117,045 |
Source: Public Records
Tax History Compared to Growth
Tax History
| Year | Tax Paid | Tax Assessment Tax Assessment Total Assessment is a certain percentage of the fair market value that is determined by local assessors to be the total taxable value of land and additions on the property. | Land | Improvement |
|---|---|---|---|---|
| 2025 | $3,398 | $328,569 | $132,729 | $195,840 |
| 2024 | $3,359 | $322,127 | $130,127 | $192,000 |
| 2023 | $3,359 | $315,812 | $127,576 | $188,236 |
| 2022 | $3,308 | $309,621 | $125,075 | $184,546 |
| 2021 | $3,303 | $303,551 | $122,623 | $180,928 |
| 2020 | $3,265 | $300,439 | $121,366 | $179,073 |
| 2019 | $3,245 | $294,549 | $118,987 | $175,562 |
| 2018 | $3,207 | $288,774 | $116,654 | $172,120 |
| 2017 | $3,147 | $283,113 | $114,367 | $168,746 |
| 2016 | $2,969 | $277,563 | $112,125 | $165,438 |
| 2015 | $2,927 | $273,394 | $110,441 | $162,953 |
| 2014 | $2,819 | $268,039 | $108,278 | $159,761 |
Source: Public Records
Map
Nearby Homes
- 626 Juno Ct
- 483 Violet Ave
- 368 Avenida de Amigos
- 450 Avenida de Socios Unit 12
- 232 Scarlett Cir
- 522 Higos Way
- 725 Monarch Ln
- 525 Grande Ave Unit D
- Mesa Plan at Hill Street Terraces - Hill Street Series
- Pacific Plan at Hill Street Terraces - Hill Street Series
- Monarch Plan at Hill Street Terraces - Hill Street Series
- Rancho Plan at Hill Street Terraces - Hill Street Series
- Dana Plan at Hill Street Terraces - Hill Street Series
- 680 Hill St
- 840 Story St
- 719 W Tefft St
- 424 Bermuda Place
- 945 Jeanette Ln
- 449 W Tefft St Unit 23
- 449 W Tefft St Unit 13
- 436 Alegre Ave
- 456 Alegre Ave
- 454 Meredith Ave
- 462 Meredith Ave
- 444 Meredith Ave
- 428 Alegre Ave
- 466 Alegre Ave
- 457 Alegre Ave
- 474 Meredith Ave
- 432 Meredith Ave
- 435 Alegre Ave
- 420 Alegre Ave
- 427 Alegre Ave
- 476 Alegre Ave
- 482 Meredith Ave
- 428 Meredith Ave
- 675 Mesa Sands Way
- 421 Alegre Ave
- 678 Mesa Sands Way