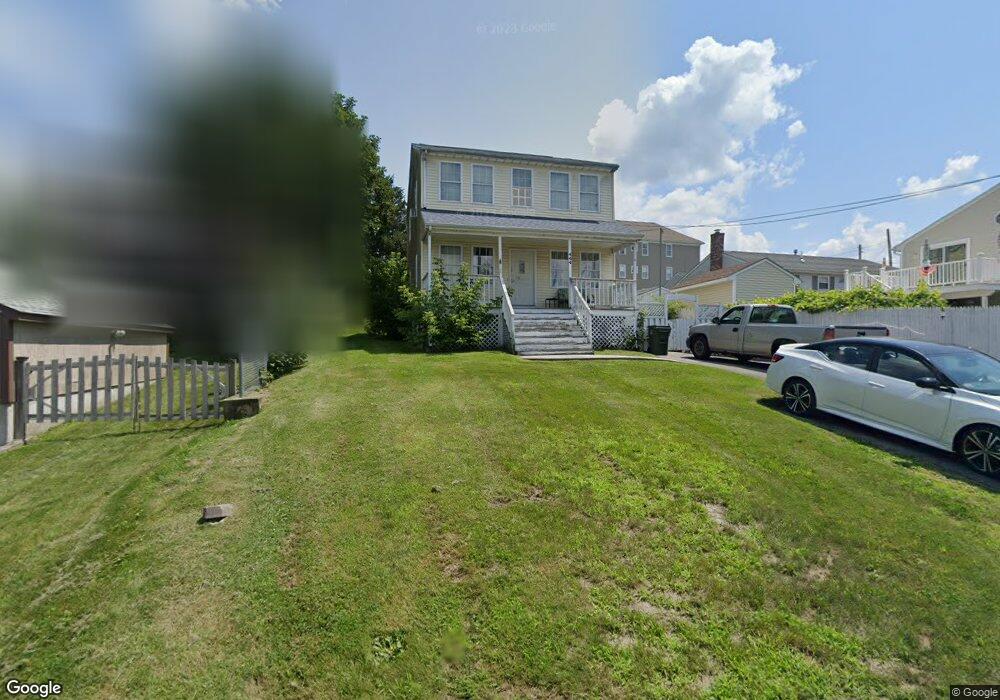
444 Bayview St Fall River, MA 02724
Sandy Beach NeighborhoodEstimated Value: $424,829 - $525,000
3
Beds
2
Baths
1,536
Sq Ft
$307/Sq Ft
Est. Value
About This Home
This home is located at 444 Bayview St, Fall River, MA 02724 and is currently estimated at $470,957, approximately $306 per square foot. 444 Bayview St is a home located in Bristol County with nearby schools including Henry Lord Community School, B M C Durfee High School, and Argosy Collegiate Charter School.
Ownership History
Date
Name
Owned For
Owner Type
Purchase Details
Closed on
Sep 21, 2001
Sold by
Pontes Joseph C
Bought by
Valois Roland L and Valois Irene M
Current Estimated Value
Home Financials for this Owner
Home Financials are based on the most recent Mortgage that was taken out on this home.
Original Mortgage
$171,100
Outstanding Balance
$66,671
Interest Rate
6.98%
Mortgage Type
Purchase Money Mortgage
Estimated Equity
$404,286
Create a Home Valuation Report for This Property
The Home Valuation Report is an in-depth analysis detailing your home's value as well as a comparison with similar homes in the area
Home Values in the Area
Average Home Value in this Area
Purchase History
| Date | Buyer | Sale Price | Title Company |
|---|---|---|---|
| Valois Roland L | $168,400 | -- |
Source: Public Records
Mortgage History
| Date | Status | Borrower | Loan Amount |
|---|---|---|---|
| Open | Valois Roland L | $171,100 |
Source: Public Records
Tax History
| Year | Tax Paid | Tax Assessment Tax Assessment Total Assessment is a certain percentage of the fair market value that is determined by local assessors to be the total taxable value of land and additions on the property. | Land | Improvement |
|---|---|---|---|---|
| 2025 | $4,136 | $361,200 | $121,700 | $239,500 |
| 2024 | $3,901 | $339,500 | $119,300 | $220,200 |
| 2023 | $4,031 | $328,500 | $107,500 | $221,000 |
| 2022 | $3,595 | $284,900 | $101,400 | $183,500 |
| 2021 | $3,518 | $254,400 | $96,900 | $157,500 |
| 2020 | $5,056 | $239,800 | $92,400 | $147,400 |
| 2019 | $5,842 | $238,000 | $96,600 | $141,400 |
| 2018 | $4,832 | $211,000 | $81,900 | $129,100 |
| 2017 | $4,625 | $210,400 | $83,600 | $126,800 |
| 2016 | $2,811 | $206,200 | $87,100 | $119,100 |
| 2015 | $2,749 | $210,200 | $83,900 | $126,300 |
| 2014 | $2,700 | $214,600 | $88,300 | $126,300 |
Source: Public Records
Map
Nearby Homes
- 579 Summit St Unit 3
- 579 Summit St Unit 2
- 391 Clarkson St
- 30 Broad St
- 42 Main Rd
- 126 Wheeler St
- 2229 S Main St
- 616 Woodman St
- 25 Mathew Rd
- 29 Robert St
- 24 Valley St
- 15 Higgins St
- 17 Lynwood St
- 57 Larouche St
- 24 Bronson St
- 0 Cypress Ave
- 4 Bronson St
- 347 Main Rd Unit 103
- 12 Horizon Dr
- 609 King Philip St
Your Personal Tour Guide
Ask me questions while you tour the home.