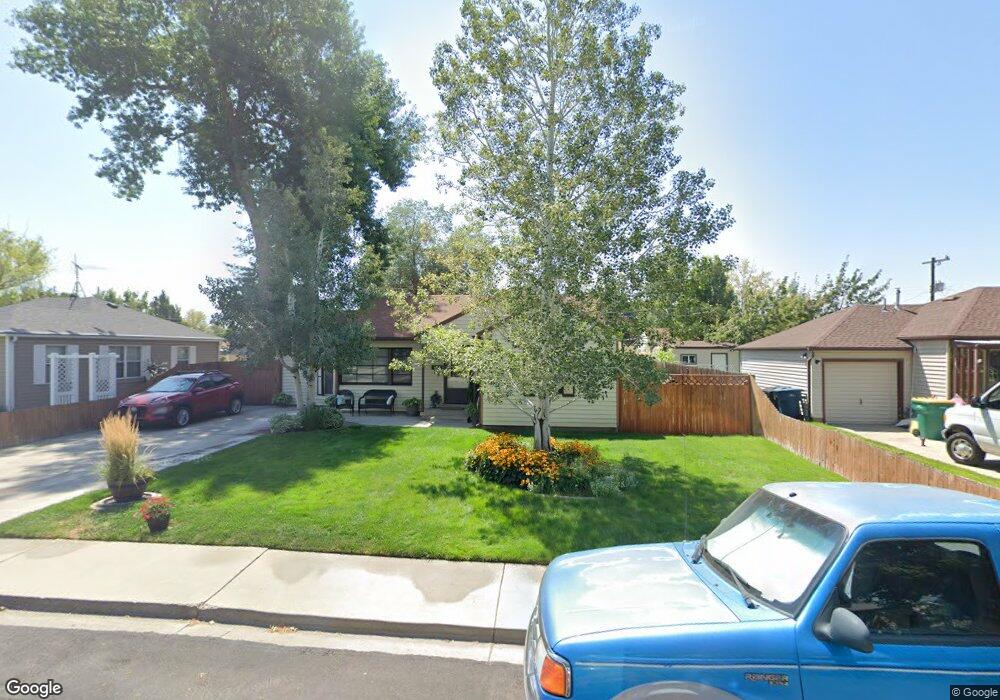
444 E 1834 S Orem, UT 84058
Cherry Hill NeighborhoodEstimated Value: $395,000 - $410,000
3
Beds
1
Bath
1,108
Sq Ft
$361/Sq Ft
Est. Value
About This Home
This home is located at 444 E 1834 S, Orem, UT 84058 and is currently estimated at $400,316, approximately $361 per square foot. 444 E 1834 S is a home located in Utah County with nearby schools including Cherry Hill Elementary School, Lakeridge Jr High School, and Mountain View High School.
Ownership History
Date
Name
Owned For
Owner Type
Purchase Details
Closed on
Mar 25, 2021
Sold by
Kelsey Peggy A
Bought by
Kelsey David W and Kelsey Peggy A
Current Estimated Value
Purchase Details
Closed on
Apr 29, 2004
Sold by
Kelsey David W and Kelsey Peggy A
Bought by
Kelsey Peggy A
Home Financials for this Owner
Home Financials are based on the most recent Mortgage that was taken out on this home.
Original Mortgage
$104,000
Interest Rate
5.35%
Mortgage Type
New Conventional
Create a Home Valuation Report for This Property
The Home Valuation Report is an in-depth analysis detailing your home's value as well as a comparison with similar homes in the area
Home Values in the Area
Average Home Value in this Area
Purchase History
| Date | Buyer | Sale Price | Title Company |
|---|---|---|---|
| Kelsey David W | -- | None Available | |
| Kelsey Peggy A | -- | Lone Peak Title Insurance | |
| Kelsey Peggy A | -- | Lone Peak Title |
Source: Public Records
Mortgage History
| Date | Status | Borrower | Loan Amount |
|---|---|---|---|
| Closed | Kelsey Peggy A | $104,000 |
Source: Public Records
Tax History
| Year | Tax Paid | Tax Assessment Tax Assessment Total Assessment is a certain percentage of the fair market value that is determined by local assessors to be the total taxable value of land and additions on the property. | Land | Improvement |
|---|---|---|---|---|
| 2025 | $1,465 | $194,700 | -- | -- |
| 2024 | $1,465 | $179,135 | $0 | $0 |
| 2023 | $1,328 | $174,515 | $0 | $0 |
| 2022 | $1,522 | $193,820 | $0 | $0 |
| 2021 | $1,324 | $255,400 | $123,400 | $132,000 |
| 2020 | $1,197 | $226,900 | $98,700 | $128,200 |
| 2019 | $1,028 | $202,700 | $85,500 | $117,200 |
| 2018 | $978 | $184,100 | $82,200 | $101,900 |
| 2017 | $895 | $90,310 | $0 | $0 |
| 2016 | $910 | $84,645 | $0 | $0 |
| 2015 | $906 | $79,695 | $0 | $0 |
| 2014 | $852 | $74,635 | $0 | $0 |
Source: Public Records
Map
Nearby Homes
Your Personal Tour Guide
Ask me questions while you tour the home.