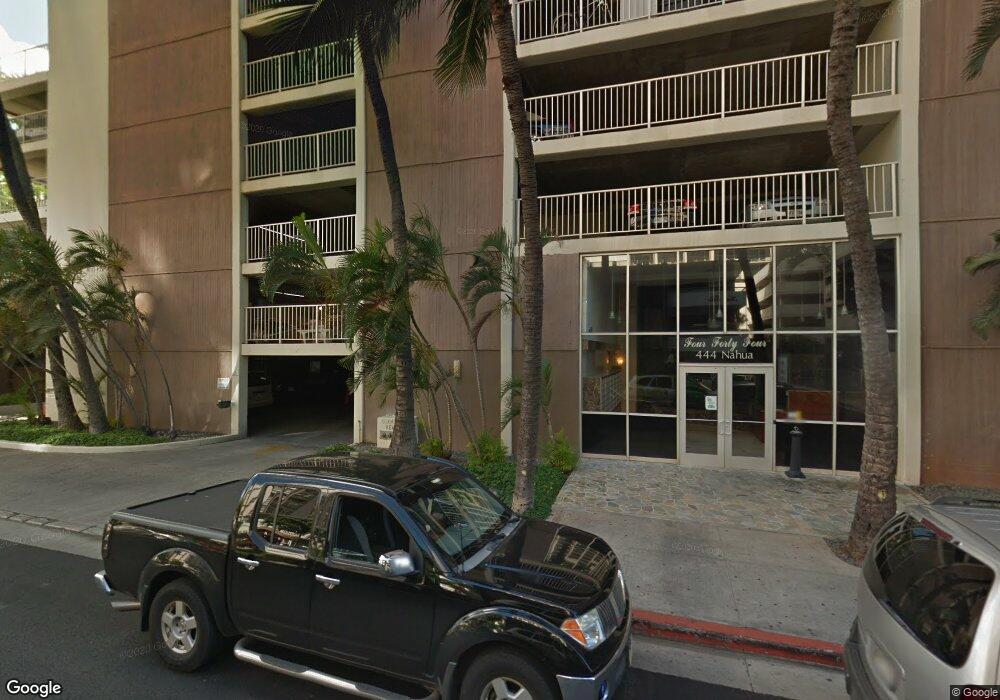
Waikiki Beach Condominiums 444 Nahua St Unit 1712 Honolulu, HI 96815
Waikiki NeighborhoodEstimated Value: $346,897 - $434,000
--
Bed
1
Bath
429
Sq Ft
$892/Sq Ft
Est. Value
About This Home
This home is located at 444 Nahua St Unit 1712, Honolulu, HI 96815 and is currently estimated at $382,474, approximately $891 per square foot. 444 Nahua St Unit 1712 is a home located in Honolulu County with nearby schools including President Thomas Jefferson Elementary School, President George Washington Middle School, and Kaimuki High School.
Ownership History
Date
Name
Owned For
Owner Type
Purchase Details
Closed on
Mar 9, 2011
Sold by
Troedson Mark Albert and Troedson Kumhui
Bought by
Troedson Mark A and Mark A Troedson Revocable Trust
Current Estimated Value
Purchase Details
Closed on
Jun 15, 2010
Sold by
Schreiber Joyce Ann
Bought by
Troedson Mark Albert and Troedson Kumhui
Purchase Details
Closed on
Jan 20, 2006
Sold by
Stackhouse Hwa Ki
Bought by
Schreiber Joyce Ann
Purchase Details
Closed on
Dec 16, 2003
Sold by
Fethler James Charles and Fethler Genny Jane
Bought by
Stackhouse Hwa Ki
Home Financials for this Owner
Home Financials are based on the most recent Mortgage that was taken out on this home.
Original Mortgage
$140,000
Interest Rate
5.97%
Mortgage Type
Unknown
Purchase Details
Closed on
Oct 8, 2002
Sold by
Association Of Apartment Owners Of Four
Bought by
Fethler James Charles and Fethler Genny Jane
Create a Home Valuation Report for This Property
The Home Valuation Report is an in-depth analysis detailing your home's value as well as a comparison with similar homes in the area
Home Values in the Area
Average Home Value in this Area
Purchase History
| Date | Buyer | Sale Price | Title Company |
|---|---|---|---|
| Troedson Mark A | -- | None Available | |
| Troedson Mark Albert | $255,000 | Itc | |
| Schreiber Joyce Ann | $280,000 | Fntic | |
| Stackhouse Hwa Ki | $195,000 | -- | |
| Fethler James Charles | $22,300 | -- |
Source: Public Records
Mortgage History
| Date | Status | Borrower | Loan Amount |
|---|---|---|---|
| Previous Owner | Stackhouse Hwa Ki | $140,000 |
Source: Public Records
Tax History Compared to Growth
Tax History
| Year | Tax Paid | Tax Assessment Tax Assessment Total Assessment is a certain percentage of the fair market value that is determined by local assessors to be the total taxable value of land and additions on the property. | Land | Improvement |
|---|---|---|---|---|
| 2025 | $1,226 | $381,600 | $107,200 | $274,400 |
| 2024 | $1,226 | $350,400 | $113,100 | $237,300 |
| 2023 | $1,199 | $342,500 | $109,600 | $232,900 |
| 2022 | $1,137 | $324,900 | $107,200 | $217,700 |
| 2021 | $1,092 | $312,100 | $107,200 | $204,900 |
| 2020 | $1,280 | $341,800 | $107,200 | $234,600 |
| 2019 | $1,151 | $328,800 | $89,300 | $239,500 |
| 2018 | $1,154 | $329,700 | $77,400 | $252,300 |
| 2017 | $1,093 | $312,300 | $59,500 | $252,800 |
| 2016 | $1,068 | $305,100 | $48,800 | $256,300 |
| 2015 | $1,054 | $301,000 | $41,700 | $259,300 |
| 2014 | $849 | $285,700 | $32,700 | $253,000 |
Source: Public Records
About Waikiki Beach Condominiums
Map
Nearby Homes
- 444 Nahua St Unit 1110
- 444 Nahua St Unit 1901
- 444 Nahua St Unit 903
- 444 Nahua St Unit 1104
- 444 Nahua St Unit 2007
- 444 Nahua St Unit 2005
- 431 Nahua St Unit 309
- 2345 Ala Wai Blvd Unit 2016
- 2345 Ala Wai Blvd Unit 2201
- 2345 Ala Wai Blvd Unit 1015
- 2345 Ala Wai Blvd Unit 2210
- 2345 Ala Wai Blvd Unit 1010
- 2345 Ala Wai Blvd Unit 1906
- 410 Nahua St Unit 204
- 410 Nahua St Unit 106
- 410 Nahua St Unit 302
- 410 Nahua St Unit 404
- 410 Nahua St Unit 501
- 417 Nohonani St Unit 405
- 417 Nohonani St Unit 312
- 444 Nahua St Unit 806
- 444 Nahua St Unit 1001
- 444 Nahua St Unit 901
- 444 Nahua St Unit 1202
- 444 Nahua St Unit 1003
- 444 Nahua St Unit 1704
- 444 Nahua St Unit 1808
- 444 Nahua St Unit 1108
- 444 Nahua St Unit 2203
- 444 Nahua St Unit 1211
- 444 Nahua St Unit 1807
- 444 Nahua St Unit 1210
- 444 Nahua St Unit 1102
- 444 Nahua St Unit 808
- 444 Nahua St Unit 2110
- 444 Nahua St Unit 2206
- 444 Nahua St Unit 1802
- 444 Nahua St Unit 803
- 444 Nahua St Unit 1605
- 444 Nahua St Unit 2103