444 S 2nd St E Aurora, MN 55705
Estimated Value: $91,000 - $152,993
2
Beds
2
Baths
1,280
Sq Ft
$103/Sq Ft
Est. Value
About This Home
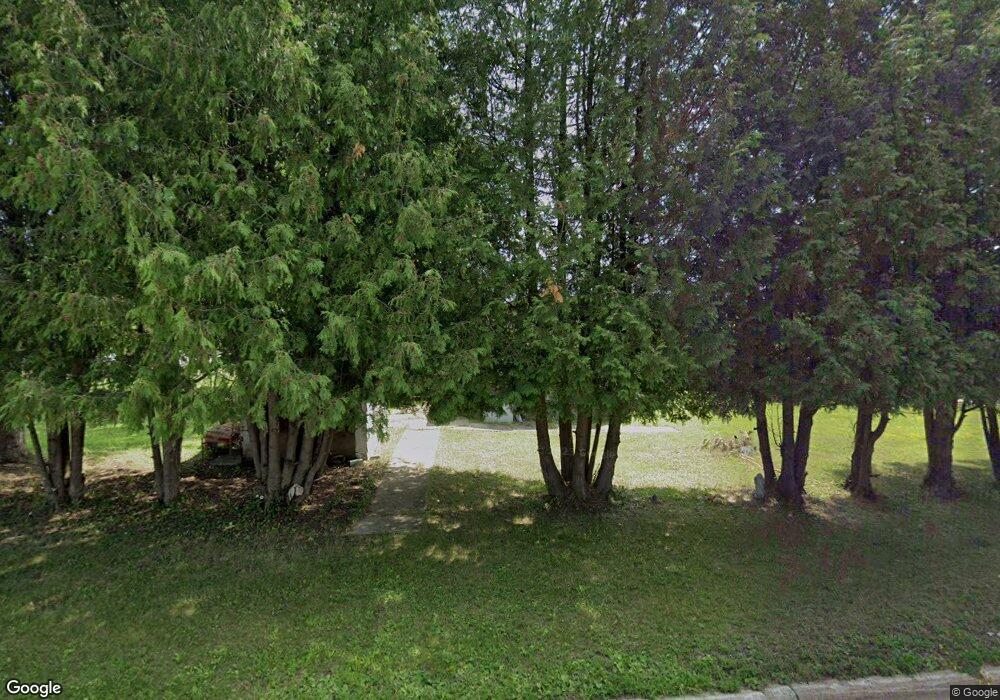
This home is located at 444 S 2nd St E, Aurora, MN 55705 and is currently estimated at $132,248, approximately $103 per square foot. 444 S 2nd St E is a home located in St. Louis County with nearby schools including Mesabi East Elementary School and Mesabi East Secondary School.
Ownership History
Date
Name
Owned For
Owner Type
Purchase Details
Closed on
May 31, 2011
Sold by
Colburn Ventures Llc
Bought by
Meacham Scot and Harris Vicki
Current Estimated Value
Purchase Details
Closed on
May 10, 2011
Sold by
Queen City Federal Savings Bank
Bought by
Colburn Ventures Llc
Purchase Details
Closed on
Sep 27, 2010
Sold by
Shanks Gregory A and Shanks Julia M
Bought by
Queen City Federal Savings Bank
Purchase Details
Closed on
Sep 5, 2003
Sold by
Sahr Jason A and Shanks Marie J
Bought by
Shanks Gregory A and Shanks Julia M
Home Financials for this Owner
Home Financials are based on the most recent Mortgage that was taken out on this home.
Original Mortgage
$16,000
Interest Rate
6.5%
Mortgage Type
Purchase Money Mortgage
Purchase Details
Closed on
May 22, 2002
Sold by
Collins Sandra
Bought by
Sahr Jason A and Shanks Marie J
Home Financials for this Owner
Home Financials are based on the most recent Mortgage that was taken out on this home.
Original Mortgage
$27,300
Interest Rate
7.37%
Create a Home Valuation Report for This Property
The Home Valuation Report is an in-depth analysis detailing your home's value as well as a comparison with similar homes in the area
Purchase History
| Date | Buyer | Sale Price | Title Company |
|---|---|---|---|
| Meacham Scot | $15,000 | None Available | |
| Colburn Ventures Llc | -- | Northeast Title Company | |
| Colburn Ventures Llc | $3,700 | Northeast Title Company | |
| Queen City Federal Savings Bank | $8,355 | None Available | |
| Shanks Gregory A | $26,000 | Consolidated Title Dul | |
| Sahr Jason A | $30,500 | -- |
Source: Public Records
Mortgage History
| Date | Status | Borrower | Loan Amount |
|---|---|---|---|
| Previous Owner | Shanks Gregory A | $16,000 | |
| Previous Owner | Sahr Jason A | $27,300 | |
| Closed | Meacham Scot | $0 |
Source: Public Records
Tax History
| Year | Tax Paid | Tax Assessment Tax Assessment Total Assessment is a certain percentage of the fair market value that is determined by local assessors to be the total taxable value of land and additions on the property. | Land | Improvement |
|---|---|---|---|---|
| 2024 | $26 | $3,200 | $3,200 | $0 |
| 2023 | $26 | $3,200 | $3,200 | $0 |
| 2022 | $82 | $22,800 | $3,900 | $18,900 |
| 2021 | $80 | $16,700 | $3,400 | $13,300 |
| 2020 | $70 | $15,400 | $3,400 | $12,000 |
| 2019 | $70 | $15,400 | $3,400 | $12,000 |
| 2018 | $100 | $15,300 | $3,300 | $12,000 |
| 2017 | $104 | $22,600 | $4,900 | $17,700 |
| 2016 | $100 | $23,800 | $4,900 | $18,900 |
| 2015 | $96 | $12,500 | $2,500 | $10,000 |
| 2014 | $96 | $12,600 | $2,600 | $10,000 |
Source: Public Records
Map
Nearby Homes
- 408 S 2nd St E
- 421 Main St S
- TBD South Ave
- 5316 Highway 110
- 14 E 4th Ave S
- 522 S 3rd St W
- 312 S 2nd St W
- 213 S 2nd St W
- 307 S 6th St E
- 204 S 5th St E
- 15 W 4th Ave N
- 112 W 3rd Ave N
- 311 W 2nd Ave N
- 213 & 215 W 4th Ave N
- 710 Maple Dr
- TBD Lane 55 County Road 341
- XXXX Road 53
- xxxx Deer Forest Rd
- TBD Voyageurs Trail
- TBD Holland Dr
- 440 S 2nd St E
- 443 S 3rd St E
- 441 S 3rd St E
- 445 S 2nd St E
- 436 S 2nd St E
- 5236 Highway 110
- 5242 Highway 110
- 437 S 3rd St E
- 432 S 2nd St E
- 434 S 2nd St E
- 5492 Spruce St
- 5492 S Spruce Dr
- 437 S 2nd St E
- 5230 Highway 110
- 435 S 3rd St E
- 430 S 2nd St E
- 5228 Highway 110
- 428 S 2nd St E
- 433 S 2nd St E
- 431 S 3rd St E
Your Personal Tour Guide
Ask me questions while you tour the home.