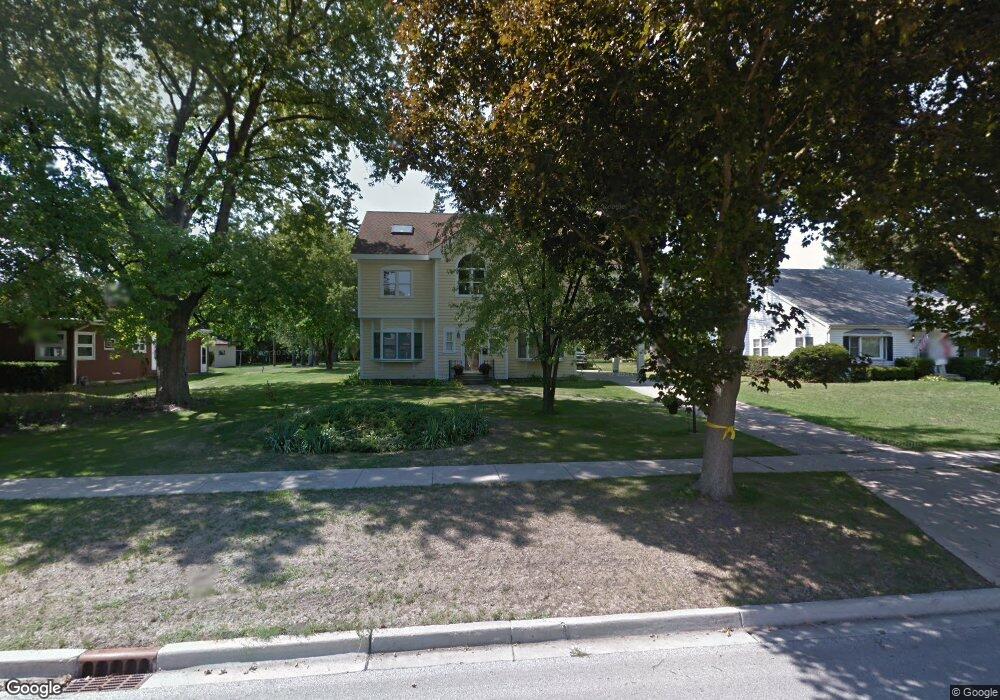
444 S Maple St Itasca, IL 60143
South Itasca NeighborhoodEstimated Value: $524,000 - $601,000
Studio
1
Bath
3,112
Sq Ft
$181/Sq Ft
Est. Value
About This Home
This home is located at 444 S Maple St, Itasca, IL 60143 and is currently estimated at $562,526, approximately $180 per square foot. 444 S Maple St is a home located in DuPage County with nearby schools including Raymond Benson Primary School, Elmer H Franzen Intermediate School, and F.E. Peacock Middle School.
Ownership History
Date
Name
Owned For
Owner Type
Purchase Details
Closed on
Jul 6, 2005
Sold by
Vorgias Carrie Ann
Bought by
Vorgias Louis
Current Estimated Value
Purchase Details
Closed on
Dec 14, 2000
Sold by
Milewski Theodore M and Milewski Joyce M
Bought by
Vorgias Louis T and Vorgias Carrie A
Home Financials for this Owner
Home Financials are based on the most recent Mortgage that was taken out on this home.
Original Mortgage
$180,000
Interest Rate
7.77%
Create a Home Valuation Report for This Property
The Home Valuation Report is an in-depth analysis detailing your home's value as well as a comparison with similar homes in the area
Home Values in the Area
Average Home Value in this Area
Purchase History
| Date | Buyer | Sale Price | Title Company |
|---|---|---|---|
| Vorgias Louis | -- | -- | |
| Vorgias Louis T | $225,000 | -- |
Source: Public Records
Mortgage History
| Date | Status | Borrower | Loan Amount |
|---|---|---|---|
| Previous Owner | Vorgias Louis T | $180,000 |
Source: Public Records
Tax History
| Year | Tax Paid | Tax Assessment Tax Assessment Total Assessment is a certain percentage of the fair market value that is determined by local assessors to be the total taxable value of land and additions on the property. | Land | Improvement |
|---|---|---|---|---|
| 2024 | $10,440 | $159,755 | $87,133 | $72,622 |
| 2023 | $10,011 | $146,860 | $80,100 | $66,760 |
| 2022 | $9,653 | $141,220 | $76,630 | $64,590 |
| 2021 | $9,181 | $135,270 | $73,400 | $61,870 |
| 2020 | $8,836 | $129,570 | $70,310 | $59,260 |
| 2019 | $8,632 | $124,590 | $67,610 | $56,980 |
| 2018 | $8,897 | $124,590 | $67,610 | $56,980 |
| 2017 | $8,369 | $119,080 | $64,620 | $54,460 |
| 2016 | $8,100 | $109,940 | $59,660 | $50,280 |
| 2015 | $7,861 | $101,560 | $55,110 | $46,450 |
| 2014 | $9,061 | $110,840 | $53,490 | $57,350 |
| 2013 | $8,851 | $113,100 | $54,580 | $58,520 |
Source: Public Records
Map
Nearby Homes
- 206 E George St
- 312 S Maple St
- 501 S Cherry St
- 100 S Walnut St
- 272 Prospect Ave
- 711 E Greenview Rd
- 21W051 Woodview Dr
- 1227 N Ashley Ln
- 1 Itasca Place Unit 412
- 175 N Clare Ct
- 488 W Jason Ln
- 5N210 Central Rd
- 1200 N Foxdale Dr Unit 205
- 1200 N Foxdale Dr Unit 100
- 1137 N Itasca Rd
- 1130 N Thatcher Ln
- 483 Forest Preserve Dr Unit 2
- 1210 N Foxdale Dr Unit 109
- 665 Catherine Ct Unit 31BR
- 829 Clover Ridge Ln
Your Personal Tour Guide
Ask me questions while you tour the home.