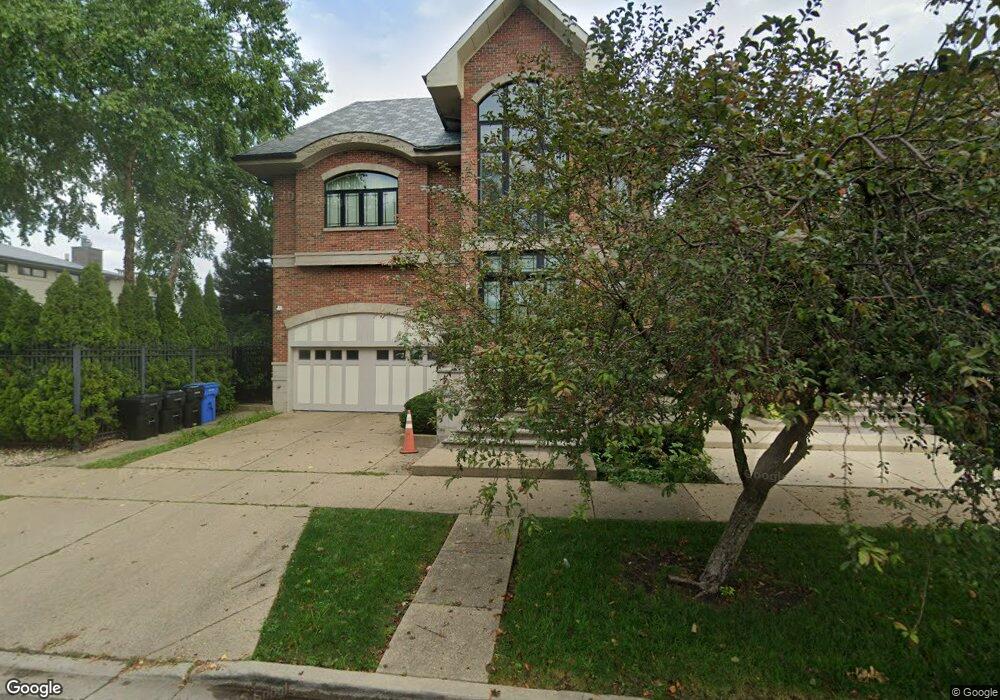
444 W 38th St Chicago, IL 60609
Bridgeport NeighborhoodEstimated Value: $859,000 - $1,360,000
4
Beds
4
Baths
6,200
Sq Ft
$188/Sq Ft
Est. Value
About This Home
This home is located at 444 W 38th St, Chicago, IL 60609 and is currently estimated at $1,162,867, approximately $187 per square foot. 444 W 38th St is a home located in Cook County with nearby schools including McClellan Elementary School, Bridgeport Catholic Academy - South Campus, and St Gabriel Elementary School.
Ownership History
Date
Name
Owned For
Owner Type
Purchase Details
Closed on
Dec 28, 2016
Sold by
Russell Scalise
Bought by
Mui Wendy
Current Estimated Value
Home Financials for this Owner
Home Financials are based on the most recent Mortgage that was taken out on this home.
Original Mortgage
$820,000
Outstanding Balance
$679,199
Interest Rate
4.3%
Estimated Equity
$483,668
Purchase Details
Closed on
Sep 2, 2010
Sold by
Duddleston Thomas H and Duddleston Kathleen S
Bought by
Chicago Title Land Trust Company and Trust #8002355588
Home Financials for this Owner
Home Financials are based on the most recent Mortgage that was taken out on this home.
Original Mortgage
$780,000
Interest Rate
4.49%
Mortgage Type
New Conventional
Purchase Details
Closed on
Jul 12, 2004
Sold by
Lakeside Bank
Bought by
Duddleston Thomas H and Duddleston Kathleen S
Create a Home Valuation Report for This Property
The Home Valuation Report is an in-depth analysis detailing your home's value as well as a comparison with similar homes in the area
Home Values in the Area
Average Home Value in this Area
Purchase History
| Date | Buyer | Sale Price | Title Company |
|---|---|---|---|
| Mui Wendy | -- | -- | |
| Chicago Title Land Trust Company | $975,000 | Chicago Title Land Trust Co | |
| Duddleston Thomas H | $200,000 | Freedom Title Corp |
Source: Public Records
Mortgage History
| Date | Status | Borrower | Loan Amount |
|---|---|---|---|
| Open | Mui Wendy | $820,000 | |
| Closed | Mui Wendy | -- | |
| Previous Owner | Chicago Title Land Trust Company | $780,000 |
Source: Public Records
Tax History Compared to Growth
Tax History
| Year | Tax Paid | Tax Assessment Tax Assessment Total Assessment is a certain percentage of the fair market value that is determined by local assessors to be the total taxable value of land and additions on the property. | Land | Improvement |
|---|---|---|---|---|
| 2024 | $10,173 | $63,428 | $18,121 | $45,307 |
| 2023 | $9,907 | $49,875 | $14,630 | $35,245 |
| 2022 | $9,907 | $49,875 | $14,630 | $35,245 |
| 2021 | $9,695 | $49,875 | $14,630 | $35,245 |
| 2020 | $9,845 | $45,746 | $14,630 | $31,116 |
| 2019 | $9,982 | $51,400 | $14,630 | $36,770 |
| 2018 | $9,814 | $51,401 | $14,630 | $36,771 |
| 2017 | $9,680 | $46,656 | $11,637 | $35,019 |
| 2016 | $9,095 | $46,656 | $11,637 | $35,019 |
| 2015 | $8,309 | $46,656 | $11,637 | $35,019 |
| 2014 | $7,766 | $43,139 | $9,975 | $33,164 |
| 2013 | $7,918 | $44,851 | $9,975 | $34,876 |
Source: Public Records
Map
Nearby Homes
- 3727 S Lowe Ave
- 3640 S Lowe Ave
- 3549 S Lowe Ave
- 3505 S Parnell Ave Unit D
- 3600 S Union Ave
- 3830 S Emerald Ave
- 3600 S Halsted St
- 3405 S Union Ave
- 3322 S Parnell Ave
- 3450 S Halsted St Unit 406
- 835 W 35th St
- 3357 S Emerald Ave
- 3315 S Lowe Ave
- 3246 S Normal Ave
- 3821 S State St
- 19 E 37th Place
- 24 E 37th Place
- 3522 S State St Unit 301
- 4204 S Wentworth Ave
- 17 W 35th St Unit 406
- 444 W 38th St
- 444 W 38th St
- 434 W 38th St
- 432 W 38th St
- 430 W 38th St
- 426 W 38th St
- 424 W 38th St
- 441 W 37th Place
- 445 W 37th Place
- 435 W 37th Place
- 431 W 37th Place
- 422 W 38th St
- 447 W 37th Place
- 429 W 37th Place
- 440 W 38th St
- 420 W 38th St
- 427 W 37th Place
- 439 W 38th St
- 437 W 38th St
- 441 W 38th St