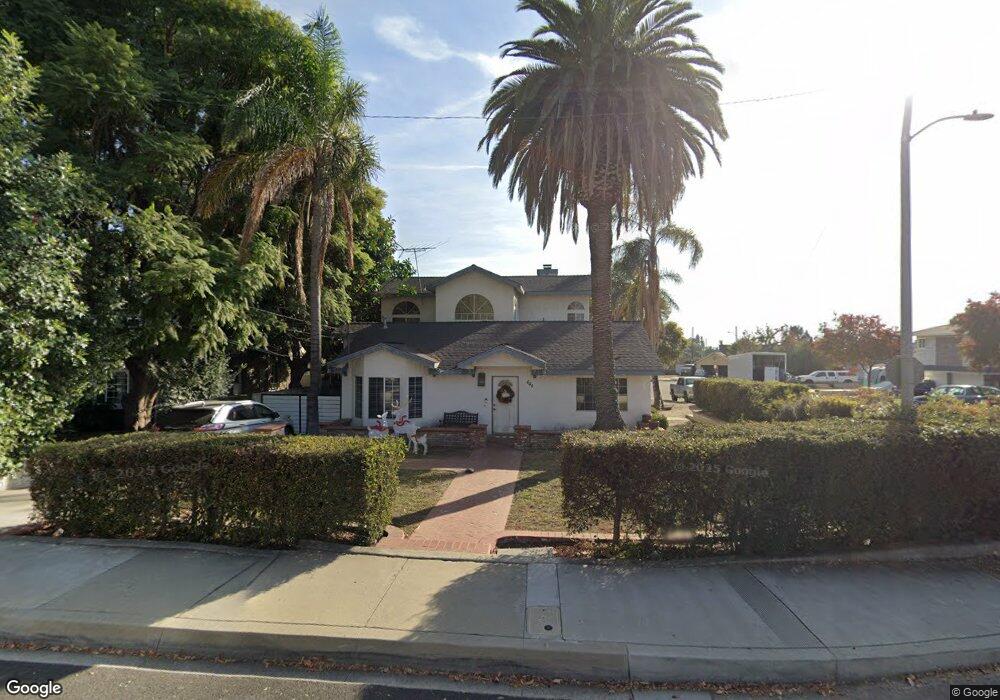
444 W 7th St Upland, CA 91786
Estimated Value: $784,000 - $1,106,000
4
Beds
2
Baths
2,468
Sq Ft
$374/Sq Ft
Est. Value
About This Home
This home is located at 444 W 7th St, Upland, CA 91786 and is currently estimated at $923,443, approximately $374 per square foot. 444 W 7th St is a home located in San Bernardino County with nearby schools including Citrus Elementary, Upland Junior High School, and Upland High School.
Ownership History
Date
Name
Owned For
Owner Type
Purchase Details
Closed on
Mar 18, 2005
Sold by
Plant Jerry W
Bought by
Arata Jose Antonio and Arata Tania Marie
Current Estimated Value
Home Financials for this Owner
Home Financials are based on the most recent Mortgage that was taken out on this home.
Original Mortgage
$463,250
Outstanding Balance
$263,531
Interest Rate
7.5%
Mortgage Type
Fannie Mae Freddie Mac
Estimated Equity
$659,912
Create a Home Valuation Report for This Property
The Home Valuation Report is an in-depth analysis detailing your home's value as well as a comparison with similar homes in the area
Home Values in the Area
Average Home Value in this Area
Purchase History
| Date | Buyer | Sale Price | Title Company |
|---|---|---|---|
| Arata Jose Antonio | $545,000 | Old Republic Title Company |
Source: Public Records
Mortgage History
| Date | Status | Borrower | Loan Amount |
|---|---|---|---|
| Open | Arata Jose Antonio | $463,250 |
Source: Public Records
Tax History Compared to Growth
Tax History
| Year | Tax Paid | Tax Assessment Tax Assessment Total Assessment is a certain percentage of the fair market value that is determined by local assessors to be the total taxable value of land and additions on the property. | Land | Improvement |
|---|---|---|---|---|
| 2025 | $8,093 | $759,685 | $265,890 | $493,795 |
| 2024 | $8,093 | $744,789 | $260,676 | $484,113 |
| 2023 | $7,973 | $730,186 | $255,565 | $474,621 |
| 2022 | $7,802 | $715,869 | $250,554 | $465,315 |
| 2021 | $7,266 | $653,000 | $229,000 | $424,000 |
| 2020 | $6,987 | $638,600 | $225,000 | $413,600 |
| 2019 | $6,898 | $620,000 | $220,000 | $400,000 |
| 2018 | $6,802 | $614,700 | $214,700 | $400,000 |
| 2017 | $6,306 | $574,500 | $200,700 | $373,800 |
| 2016 | $5,899 | $547,100 | $191,100 | $356,000 |
| 2015 | $5,574 | $521,000 | $182,000 | $339,000 |
| 2014 | $4,150 | $390,000 | $136,000 | $254,000 |
Source: Public Records
Map
Nearby Homes
- 424 W 7th St
- 384 W 7th St
- 228 Greentree Rd
- 173 Elizabeth Ln
- 345 S Euclid Ave
- 173 W 8th St
- 164 Euclid Place
- 537 W 9th St
- 119 N 1st Ave
- Plan 3 at Towns on First - Towns On First
- Plan 4 at Towns on First - Towns On First
- 1242 N Cypress Ave
- 435 W 9th St Unit A6
- 435 W 9th St Unit F5
- 1317 N Columbia Ave
- 822 W 5th St
- 371 S Alexander Ave
- 485 Highland Ct
- 946 W La Deney Dr
- 181 Dorsett Ave
- 424 W 7th St Unit 7
- 413 S Shasta Way
- 421 S Shasta Way
- 393 Vine Ave
- 430 S Shasta Way
- 415 Fern Ave
- 394 Verdugo Way
- 427 Fern Ave
- 475 Fern Ave
- 429 S Shasta Way
- 483 Fern Ave
- 497 Fern Ave
- 385 Vine Ave
- 436 S Shasta Way
- 440 S Shasta Way
- 386 Verdugo Way
- 385 W 7th St
- 404 S Tulare Way
- 435 S Shasta Way
- 439 Fern Ave