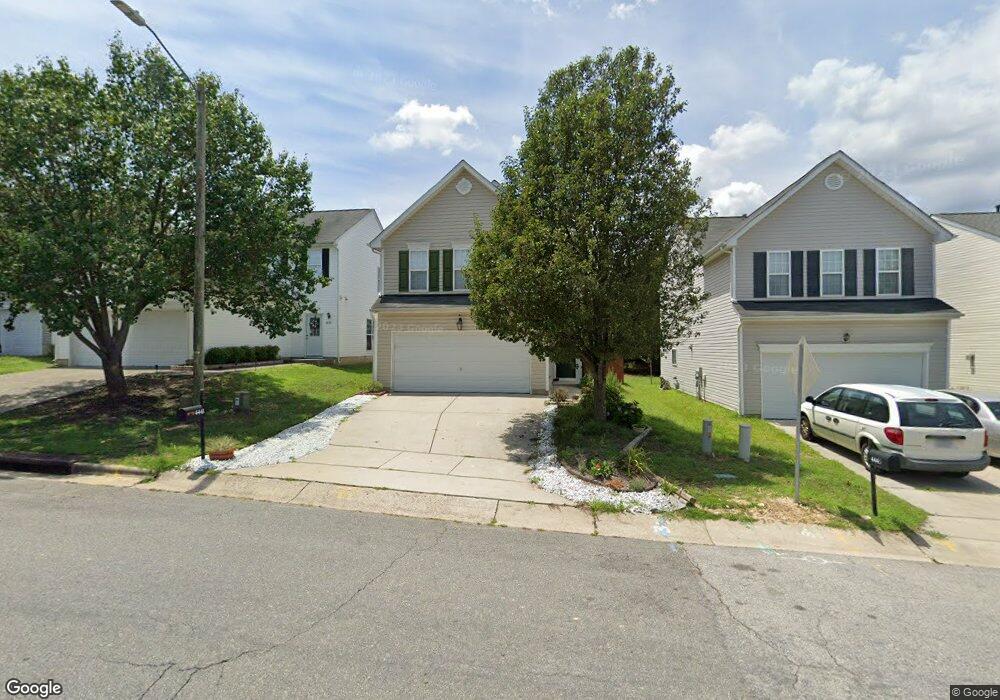
4441 Cardinal Grove Blvd Raleigh, NC 27616
Northeast Raleigh NeighborhoodEstimated Value: $304,000 - $332,000
4
Beds
3
Baths
1,600
Sq Ft
$200/Sq Ft
Est. Value
About This Home
This home is located at 4441 Cardinal Grove Blvd, Raleigh, NC 27616 and is currently estimated at $319,504, approximately $199 per square foot. 4441 Cardinal Grove Blvd is a home located in Wake County with nearby schools including Beaverdam Elementary School, River Bend Middle, and Rolesville High School.
Ownership History
Date
Name
Owned For
Owner Type
Purchase Details
Closed on
Apr 27, 2023
Sold by
Le Jackie
Bought by
Vo Kim
Current Estimated Value
Purchase Details
Closed on
Sep 20, 2011
Sold by
Ahazie Godfrey O and Ahazie Chinwe P
Bought by
Federal National Mortgage Association
Purchase Details
Closed on
Apr 28, 2006
Sold by
K Hovnanian Homes Of North Carolina Inc
Bought by
Ahazie Godfrey O and Ahazie Chinwe P
Home Financials for this Owner
Home Financials are based on the most recent Mortgage that was taken out on this home.
Original Mortgage
$23,098
Interest Rate
6.31%
Mortgage Type
Credit Line Revolving
Purchase Details
Closed on
Dec 19, 2005
Sold by
Buffaloe Investments Llc
Bought by
K Hovnanian Homes Of North Carolina Inc
Create a Home Valuation Report for This Property
The Home Valuation Report is an in-depth analysis detailing your home's value as well as a comparison with similar homes in the area
Home Values in the Area
Average Home Value in this Area
Purchase History
| Date | Buyer | Sale Price | Title Company |
|---|---|---|---|
| Vo Kim | -- | None Listed On Document | |
| Federal National Mortgage Association | $116,800 | None Available | |
| Ahazie Godfrey O | $154,000 | None Available | |
| K Hovnanian Homes Of North Carolina Inc | $104,000 | None Available |
Source: Public Records
Mortgage History
| Date | Status | Borrower | Loan Amount |
|---|---|---|---|
| Previous Owner | Ahazie Godfrey O | $23,098 | |
| Previous Owner | Ahazie Godfrey O | $123,192 |
Source: Public Records
Tax History Compared to Growth
Tax History
| Year | Tax Paid | Tax Assessment Tax Assessment Total Assessment is a certain percentage of the fair market value that is determined by local assessors to be the total taxable value of land and additions on the property. | Land | Improvement |
|---|---|---|---|---|
| 2025 | $2,805 | $319,377 | $70,000 | $249,377 |
| 2024 | $2,794 | $319,377 | $70,000 | $249,377 |
| 2023 | $2,245 | $204,086 | $40,000 | $164,086 |
| 2022 | $2,086 | $204,086 | $40,000 | $164,086 |
| 2021 | $2,006 | $204,086 | $40,000 | $164,086 |
| 2020 | $1,969 | $204,086 | $40,000 | $164,086 |
| 2019 | $1,833 | $156,459 | $36,000 | $120,459 |
| 2018 | $1,729 | $156,459 | $36,000 | $120,459 |
| 2017 | $1,648 | $156,459 | $36,000 | $120,459 |
| 2016 | $1,614 | $156,459 | $36,000 | $120,459 |
| 2015 | -- | $158,579 | $45,000 | $113,579 |
| 2014 | $1,577 | $158,579 | $45,000 | $113,579 |
Source: Public Records
Map
Nearby Homes
- 4440 Cardinal Grove Blvd
- 4348 Karlbrook Ln
- 4416 Walker Hallow St
- 4252 Rockdell Hall St
- 5525 Buffaloe Rd
- 5208 Windmere Chase Dr
- 4508 Brintons Cottage St
- 4139 Davis Meadow St
- 4416 Brintons Cottage St
- 4821 Heathshire Dr
- 4800 Arbor Lodge Dr
- 4809 Kaycee Ct
- 5325 Marthonna Way
- 5809 Iris Lake Ct
- 3412 S Beaver Ln
- 5915 River Landings Dr
- 3413 S Beaver Ln
- 3609 Neuse Estates Dr
- 3605 Windemere Place
- 4809 Arbor Chase Dr
- 4437 Cardinal Grove Blvd
- 4445 Cardinal Grove Blvd
- 4433 Cardinal Grove Blvd
- 4449 Cardinal Grove Blvd
- 4446 Snowcrest Ln
- 4442 Snowcrest Ln
- 4450 Snowcrest Ln
- 4429 Cardinal Grove Blvd
- 4453 Cardinal Grove Blvd
- 4438 Snowcrest Ln
- 4454 Snowcrest Ln
- 4434 Snowcrest Ln
- 4458 Snowcrest Ln
- 4425 Cardinal Grove Blvd
- 4457 Cardinal Grove Blvd
- 4448 Cardinal Grove Blvd Unit LT232
- 4448 Cardinal Grove Blvd
- 4432 Cardinal Grove Blvd
- 4436 Cardinal Grove Blvd
- 4462 Snowcrest Ln