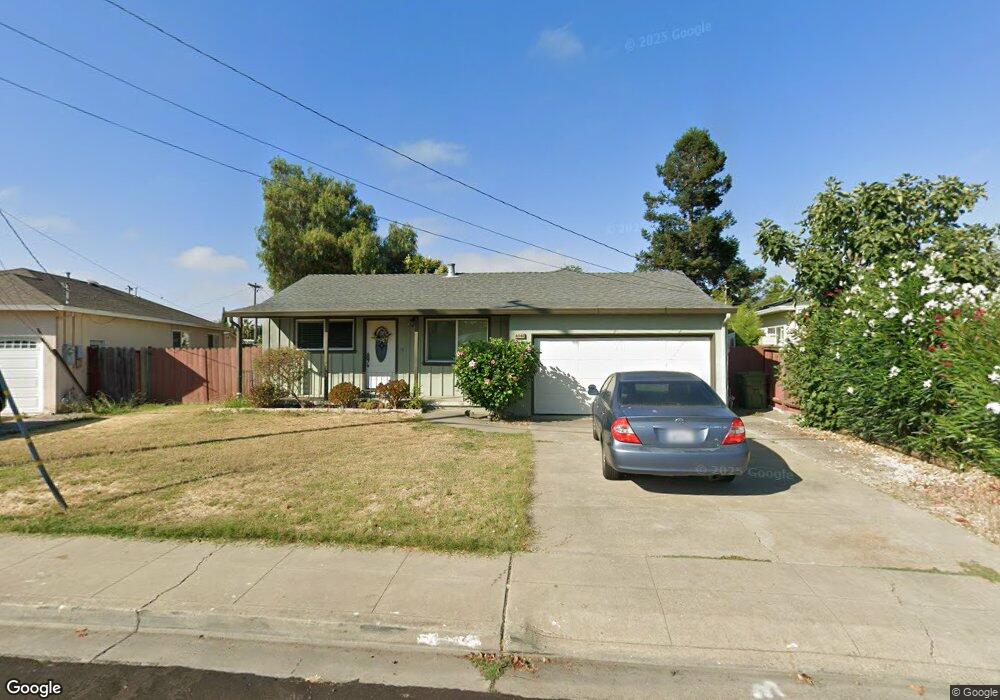
4442 Delaware Dr Fremont, CA 94538
Grimmer NeighborhoodEstimated Value: $1,462,551 - $1,583,000
3
Beds
2
Baths
1,104
Sq Ft
$1,379/Sq Ft
Est. Value
About This Home
This home is located at 4442 Delaware Dr, Fremont, CA 94538 and is currently estimated at $1,521,888, approximately $1,378 per square foot. 4442 Delaware Dr is a home located in Alameda County with nearby schools including Harvey Green Elementary School, John M. Horner Junior High School, and Irvington High School.
Ownership History
Date
Name
Owned For
Owner Type
Purchase Details
Closed on
Aug 22, 2016
Sold by
Emmett Amy Adele
Bought by
Mohammed Ibraz H and Kausar Shireen
Current Estimated Value
Home Financials for this Owner
Home Financials are based on the most recent Mortgage that was taken out on this home.
Original Mortgage
$625,550
Outstanding Balance
$498,147
Interest Rate
3.42%
Mortgage Type
New Conventional
Estimated Equity
$1,023,741
Purchase Details
Closed on
Aug 4, 2016
Sold by
Emmett Roger Allen
Bought by
Emmett Amy Adele
Home Financials for this Owner
Home Financials are based on the most recent Mortgage that was taken out on this home.
Original Mortgage
$625,550
Outstanding Balance
$498,147
Interest Rate
3.42%
Mortgage Type
New Conventional
Estimated Equity
$1,023,741
Purchase Details
Closed on
Feb 25, 2013
Sold by
Berg Tracey A
Bought by
Emmett Roger Allen and Emmett Amy Adele
Purchase Details
Closed on
Jan 19, 2004
Sold by
Berg Tracey A and Benge Kenneth D
Bought by
Berg Tracey A and Benge Kenneth D
Create a Home Valuation Report for This Property
The Home Valuation Report is an in-depth analysis detailing your home's value as well as a comparison with similar homes in the area
Home Values in the Area
Average Home Value in this Area
Purchase History
| Date | Buyer | Sale Price | Title Company |
|---|---|---|---|
| Mohammed Ibraz H | $900,000 | Fidelity National Title Co | |
| Emmett Amy Adele | -- | None Available | |
| Emmett Roger Allen | $349,500 | Old Republic Title | |
| Berg Tracey A | -- | -- |
Source: Public Records
Mortgage History
| Date | Status | Borrower | Loan Amount |
|---|---|---|---|
| Open | Mohammed Ibraz H | $625,550 |
Source: Public Records
Tax History Compared to Growth
Tax History
| Year | Tax Paid | Tax Assessment Tax Assessment Total Assessment is a certain percentage of the fair market value that is determined by local assessors to be the total taxable value of land and additions on the property. | Land | Improvement |
|---|---|---|---|---|
| 2025 | $12,347 | $1,037,504 | $464,224 | $580,280 |
| 2024 | $12,347 | $1,017,029 | $455,124 | $568,905 |
| 2023 | $12,021 | $1,003,950 | $446,200 | $557,750 |
| 2022 | $11,872 | $977,267 | $437,452 | $546,815 |
| 2021 | $11,579 | $957,971 | $428,876 | $536,095 |
| 2020 | $11,635 | $955,080 | $424,480 | $530,600 |
| 2019 | $11,501 | $936,360 | $416,160 | $520,200 |
| 2018 | $11,277 | $918,000 | $408,000 | $510,000 |
| 2017 | $10,994 | $900,000 | $400,000 | $500,000 |
| 2016 | $6,574 | $520,114 | $156,034 | $364,080 |
| 2015 | $6,498 | $512,304 | $153,691 | $358,613 |
| 2014 | $6,449 | $502,270 | $150,681 | $351,589 |
Source: Public Records
Map
Nearby Homes
- 42932 Peachwood St
- 4309 Bora Ave
- 43163 Grimmer Terrace
- 4533 Capewood Terrace
- 4537 Capewood Terrace
- 92 Delta Green
- 41882 Gifford St
- 48 Eagle Green
- 262 Manitoba Green
- 4860 Bryce Canyon Park Dr
- 202 Manitoba Terrace
- 208 Manitoba Terrace
- 261 Manitoba Green Unit 261
- 257 Manitoba Green
- 42759 Newport Dr
- 3923 Wildflower Common Unit 19
- 3872 Wildflower Common Unit 27
- 5341 Audubon Park Ct
- 4751 Wadsworth Ct
- 40696 Robin St
- 42933 Wixon Dr
- 4430 Delaware Dr
- 42884 Peachwood St
- 42866 Peachwood St
- 42885 Wixon Dr
- 4418 Delaware Dr
- 42950 Peachwood St
- 43052 Peachwood St
- 42848 Peachwood St
- 4405 Delaware Dr
- 42867 Wixon Dr
- 43068 Peachwood St
- 42764 Peachwood St
- 42883 Peachwood St
- 42931 Peachwood St
- 42849 Wixon Dr
- 4392 Delaware Dr
- 42865 Peachwood St
- 4379 Delaware Dr
- 42949 Peachwood St