Estimated Value: $598,000 - $624,000
3
Beds
2
Baths
1,474
Sq Ft
$414/Sq Ft
Est. Value
About This Home
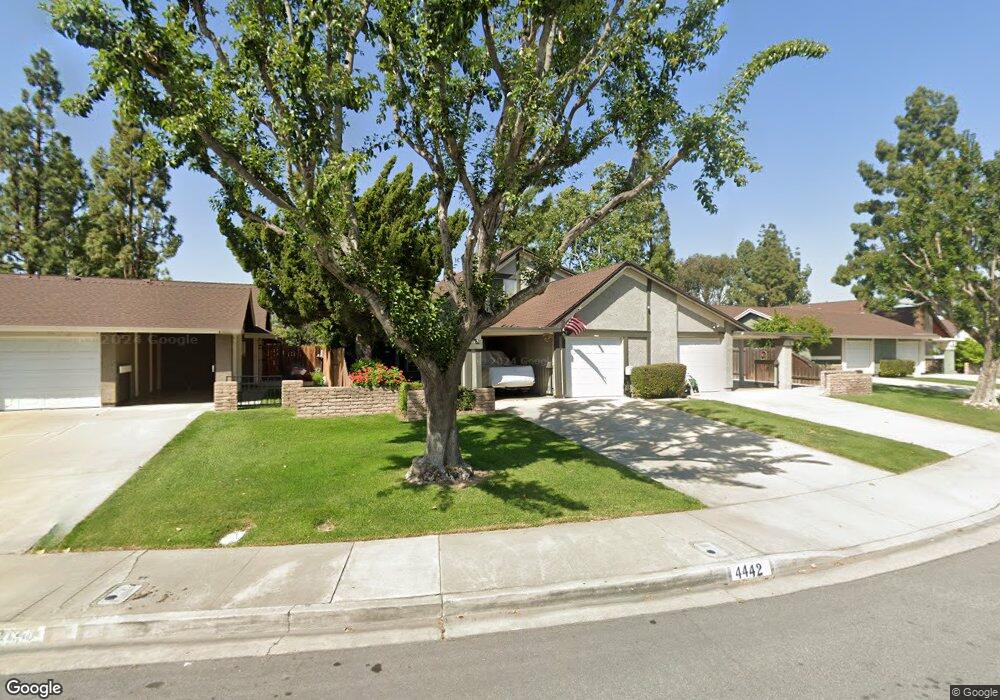
This home is located at 4442 Lidia Ct, Chino, CA 91710 and is currently estimated at $610,222, approximately $413 per square foot. 4442 Lidia Ct is a home located in San Bernardino County with nearby schools including Dickson Elementary, Ramona Junior High School, and Don Antonio Lugo High School.
Ownership History
Date
Name
Owned For
Owner Type
Purchase Details
Closed on
Aug 10, 2022
Sold by
Lourdes Nuce
Bought by
Lourdes Nuce Living Trust
Current Estimated Value
Purchase Details
Closed on
Dec 14, 2016
Sold by
Weinmann Lourdes
Bought by
Nuce Lourdes
Home Financials for this Owner
Home Financials are based on the most recent Mortgage that was taken out on this home.
Original Mortgage
$175,000
Interest Rate
4.1%
Mortgage Type
New Conventional
Purchase Details
Closed on
Oct 21, 2010
Sold by
Aceves Lourdes
Bought by
Weinmann Lourdes
Home Financials for this Owner
Home Financials are based on the most recent Mortgage that was taken out on this home.
Original Mortgage
$167,000
Interest Rate
4.33%
Mortgage Type
New Conventional
Purchase Details
Closed on
Jan 17, 2002
Sold by
Ashby Charles R
Bought by
Aceves Lourdes
Home Financials for this Owner
Home Financials are based on the most recent Mortgage that was taken out on this home.
Original Mortgage
$67,250
Interest Rate
6.84%
Create a Home Valuation Report for This Property
The Home Valuation Report is an in-depth analysis detailing your home's value as well as a comparison with similar homes in the area
Home Values in the Area
Average Home Value in this Area
Purchase History
| Date | Buyer | Sale Price | Title Company |
|---|---|---|---|
| Lourdes Nuce Living Trust | -- | None Listed On Document | |
| Nuce Lourdes | -- | Lsi Title Agency | |
| Weinmann Lourdes | -- | Advantage Title Inc | |
| Aceves Lourdes | $134,000 | Northern Counties Title |
Source: Public Records
Mortgage History
| Date | Status | Borrower | Loan Amount |
|---|---|---|---|
| Previous Owner | Nuce Lourdes | $175,000 | |
| Previous Owner | Weinmann Lourdes | $167,000 | |
| Previous Owner | Aceves Lourdes | $67,250 |
Source: Public Records
Tax History
| Year | Tax Paid | Tax Assessment Tax Assessment Total Assessment is a certain percentage of the fair market value that is determined by local assessors to be the total taxable value of land and additions on the property. | Land | Improvement |
|---|---|---|---|---|
| 2025 | $2,226 | $197,960 | $69,285 | $128,675 |
| 2024 | $2,167 | $194,078 | $67,926 | $126,152 |
| 2023 | $2,108 | $190,272 | $66,594 | $123,678 |
| 2022 | $2,018 | $186,541 | $65,288 | $121,253 |
| 2021 | $1,977 | $182,883 | $64,008 | $118,875 |
| 2020 | $1,951 | $181,008 | $63,352 | $117,656 |
| 2019 | $1,915 | $177,459 | $62,110 | $115,349 |
| 2018 | $1,872 | $173,979 | $60,892 | $113,087 |
| 2017 | $1,837 | $170,568 | $59,698 | $110,870 |
| 2016 | $1,716 | $167,223 | $58,527 | $108,696 |
| 2015 | $1,681 | $164,711 | $57,648 | $107,063 |
| 2014 | $1,647 | $161,485 | $56,519 | $104,966 |
Source: Public Records
Map
Nearby Homes
- 13148 Derby Ave
- 13140 Derby Ave
- 4621 Chino Ave
- 4115 Bernardo Ct
- 13144 Pipeline Ave
- 13065 San Clemente Ln
- 4912 G St
- 13079 Monte Vista Ave
- 3927 Christina Rd
- 13239 2nd St
- 13257 2nd St
- 13123 2nd St
- 13650 3rd St
- 12608 Ramona Ave
- 12620 Anthony Place
- 12629 Thomas Place
- 12931 4th St
- 13085 5th St
- 4152 Kennedy Ct
- 4182 Denali Ln
- 4450 Lidia Ct
- 4434 Lidia Ct
- 4426 Lidia Ct
- 4458 Lidia Ct
- 4466 Lidia Ct
- 13219 Ballestros Ave
- 13225 Ballestros Ave
- 13213 Ballestros Ave
- 4474 Lidia Ct
- 4441 Lidia Ct
- 13207 Ballestros Ave
- 4449 Lidia Ct
- 4457 Lidia Ct
- 4433 Lidia Ct
- 4482 Lidia Ct
- 4425 Lidia Ct
- 13237 Ballestros Ave
- 4465 Lidia Ct
- 4473 Lidia Ct
- 13243 Ballestros Ave
Your Personal Tour Guide
Ask me questions while you tour the home.