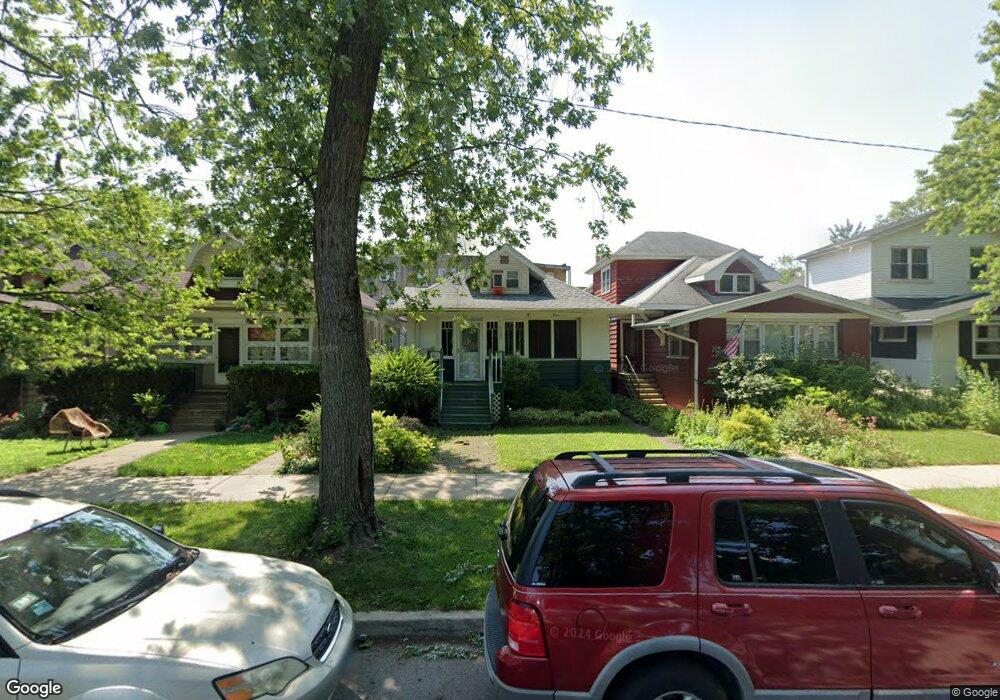
4442 N Monticello Ave Chicago, IL 60625
Albany Park NeighborhoodEstimated Value: $432,000 - $496,850
2
Beds
1
Bath
880
Sq Ft
$528/Sq Ft
Est. Value
About This Home
This home is located at 4442 N Monticello Ave, Chicago, IL 60625 and is currently estimated at $464,213, approximately $527 per square foot. 4442 N Monticello Ave is a home located in Cook County with nearby schools including Haugan Elementary School, Roosevelt High School, and ASPIRA Haugan Middle School.
Ownership History
Date
Name
Owned For
Owner Type
Purchase Details
Closed on
Sep 17, 2015
Sold by
Vail James N and Vail Joanna
Bought by
Vail Joanna
Current Estimated Value
Purchase Details
Closed on
Aug 4, 2005
Sold by
Sakellariou Shannon R and Sakellariou Panagiotis
Bought by
Vail James N and Vail Joanna
Home Financials for this Owner
Home Financials are based on the most recent Mortgage that was taken out on this home.
Original Mortgage
$194,000
Interest Rate
5.8%
Mortgage Type
Fannie Mae Freddie Mac
Purchase Details
Closed on
Dec 26, 1997
Sold by
Dienethal Merry F
Bought by
Robinson Shannon R
Home Financials for this Owner
Home Financials are based on the most recent Mortgage that was taken out on this home.
Original Mortgage
$97,000
Interest Rate
7.24%
Mortgage Type
Construction
Purchase Details
Closed on
May 16, 1995
Sold by
Turner Helen L
Bought by
Dienethal Merry F
Create a Home Valuation Report for This Property
The Home Valuation Report is an in-depth analysis detailing your home's value as well as a comparison with similar homes in the area
Home Values in the Area
Average Home Value in this Area
Purchase History
| Date | Buyer | Sale Price | Title Company |
|---|---|---|---|
| Vail Joanna | -- | Attorney | |
| Vail James N | $242,500 | First American Title | |
| Robinson Shannon R | $100,000 | Attorneys Natl Title Network | |
| Dienethal Merry F | -- | -- |
Source: Public Records
Mortgage History
| Date | Status | Borrower | Loan Amount |
|---|---|---|---|
| Previous Owner | Vail James N | $194,000 | |
| Previous Owner | Robinson Shannon R | $97,000 |
Source: Public Records
Tax History Compared to Growth
Tax History
| Year | Tax Paid | Tax Assessment Tax Assessment Total Assessment is a certain percentage of the fair market value that is determined by local assessors to be the total taxable value of land and additions on the property. | Land | Improvement |
|---|---|---|---|---|
| 2024 | $6,893 | $34,553 | $13,125 | $21,428 |
| 2023 | $7,138 | $35,870 | $10,500 | $25,370 |
| 2022 | $7,138 | $38,000 | $10,500 | $27,500 |
| 2021 | $6,995 | $38,000 | $10,500 | $27,500 |
| 2020 | $4,729 | $24,255 | $5,437 | $18,818 |
| 2019 | $4,802 | $27,253 | $5,437 | $21,816 |
| 2018 | $4,720 | $27,253 | $5,437 | $21,816 |
| 2017 | $4,369 | $23,605 | $4,875 | $18,730 |
| 2016 | $4,242 | $23,605 | $4,875 | $18,730 |
| 2015 | $3,858 | $23,605 | $4,875 | $18,730 |
| 2014 | $3,576 | $21,771 | $4,500 | $17,271 |
| 2013 | $3,494 | $21,771 | $4,500 | $17,271 |
Source: Public Records
Map
Nearby Homes
- 3733 W Sunnyside Ave
- 3550 W Montrose Ave Unit 107
- 4426 N Drake Ave
- 4304 N Lawndale Ave
- 4515 N Hamlin Ave
- 3816 W Montrose Ave
- 3707 W Cullom Ave Unit 1
- 4249 N Central Park Ave
- 4619 N Lawndale Ave Unit 1
- 4621 N Monticello Ave
- 4534 N Saint Louis Ave
- 4207 N Drake Ave
- 4416 N Harding Ave Unit 3
- 4203 N Drake Ave
- 4602 N Springfield Ave
- 4614 N Springfield Ave
- 4322 N Kimball Ave
- 4624 N Springfield Ave
- 4143 N Drake Ave
- 4115 N Ridgeway Ave
- 4438 N Monticello Ave
- 4444 N Monticello Ave
- 4436 N Monticello Ave
- 4448 N Monticello Ave
- 4432 N Monticello Ave
- 4450 N Monticello Ave
- 3646 W Agatite Ave
- 4430 N Monticello Ave
- 4454 N Monticello Ave
- 3649 W Sunnyside Ave Unit 1
- 3649 W Sunnyside Ave
- 4426 N Monticello Ave
- 4456 N Monticello Ave
- 4424 N Monticello Ave
- 4433 N Lawndale Ave
- 4443 N Monticello Ave
- 4439 N Monticello Ave
- 3651 W Sunnyside Ave
- 4445 N Monticello Ave
- 4437 N Monticello Ave