Estimated Value: $163,591 - $195,000
3
Beds
2
Baths
1,191
Sq Ft
$149/Sq Ft
Est. Value
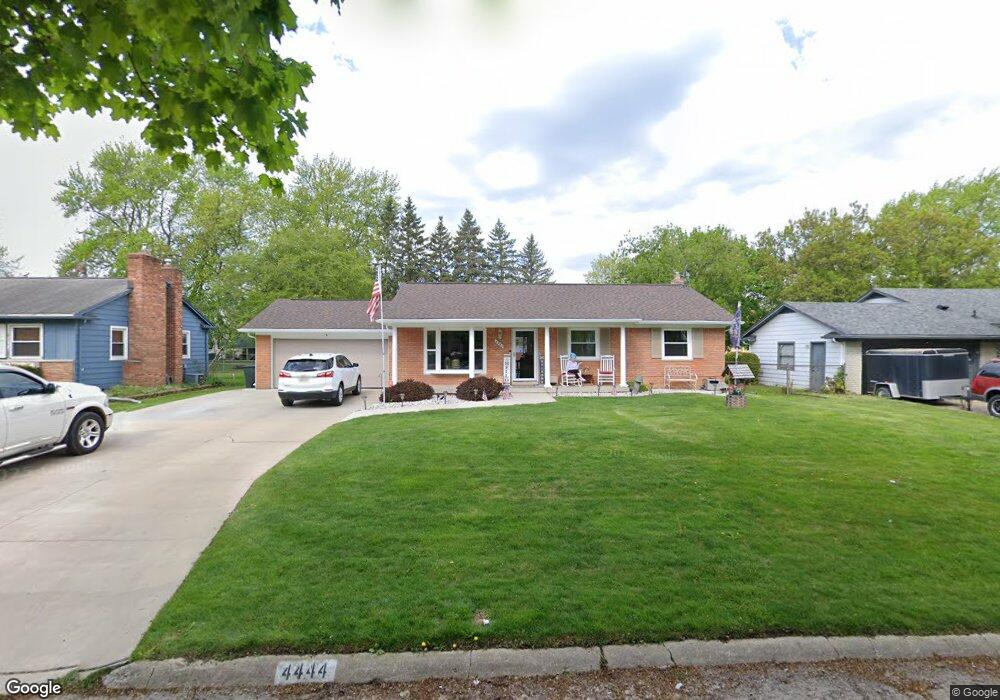
About This Home
This home is located at 4444 Old Carriage Rd, Flint, MI 48507 and is currently estimated at $177,148, approximately $148 per square foot. 4444 Old Carriage Rd is a home located in Genesee County with nearby schools including Carman-Ainsworth High School and Discovery Montessori.
Ownership History
Date
Name
Owned For
Owner Type
Purchase Details
Closed on
Sep 13, 2011
Sold by
Fannie Mae
Bought by
Sholes Kenenth G and Sholes Candance A
Current Estimated Value
Home Financials for this Owner
Home Financials are based on the most recent Mortgage that was taken out on this home.
Original Mortgage
$44,100
Outstanding Balance
$3,860
Interest Rate
4.12%
Mortgage Type
New Conventional
Estimated Equity
$173,288
Purchase Details
Closed on
Nov 4, 2010
Sold by
Wells Fargo Bank Na
Bought by
Fannie Mae
Purchase Details
Closed on
Nov 3, 2010
Sold by
Lapeen Robin M and Lapeen Dana A
Bought by
Wells Fargo Bank Na
Purchase Details
Closed on
Jun 29, 2006
Sold by
Rockafellow Janet Rae
Bought by
Lapeen Robin M and Lapeen Dana A
Create a Home Valuation Report for This Property
The Home Valuation Report is an in-depth analysis detailing your home's value as well as a comparison with similar homes in the area
Home Values in the Area
Average Home Value in this Area
Purchase History
| Date | Buyer | Sale Price | Title Company |
|---|---|---|---|
| Sholes Kenenth G | $49,000 | Attorneys Title Agency Llc | |
| Fannie Mae | -- | None Available | |
| Wells Fargo Bank Na | $151,569 | None Available | |
| Lapeen Robin M | $145,900 | Metropolitan Title Company |
Source: Public Records
Mortgage History
| Date | Status | Borrower | Loan Amount |
|---|---|---|---|
| Open | Sholes Kenenth G | $44,100 |
Source: Public Records
Tax History
| Year | Tax Paid | Tax Assessment Tax Assessment Total Assessment is a certain percentage of the fair market value that is determined by local assessors to be the total taxable value of land and additions on the property. | Land | Improvement |
|---|---|---|---|---|
| 2025 | $1,968 | $75,300 | $0 | $0 |
| 2024 | $1,006 | $69,400 | $0 | $0 |
| 2023 | $960 | $70,400 | $0 | $0 |
| 2022 | $862 | $64,000 | $0 | $0 |
| 2021 | $1,738 | $55,400 | $0 | $0 |
| 2020 | $802 | $50,700 | $0 | $0 |
| 2019 | $790 | $43,000 | $0 | $0 |
| 2018 | $1,522 | $40,500 | $0 | $0 |
| 2017 | $1,456 | $40,500 | $0 | $0 |
| 2016 | $1,514 | $34,500 | $0 | $0 |
| 2015 | $1,327 | $34,500 | $0 | $0 |
| 2014 | $787 | $33,000 | $0 | $0 |
| 2012 | -- | $33,700 | $33,700 | $0 |
Source: Public Records
Map
Nearby Homes
- 4444 Carmanwood Dr
- 4460 Bristolwood Dr
- 1203 Pickwick Place
- 2029 Gerard St
- 1489 Maria St
- 2077 Kingswood Dr
- G4203 van Slyke Rd
- 4139 Moulton Dr
- 1097 W Buder Ave
- 1449 Sunset Blvd
- 1051 W Mclean Ave
- 1085 W Parkwood Ave
- 1119 W Bergin Ave
- 1121 W Boatfield Ave
- 1508 W Bristol Rd
- 1034 W Bergin Ave
- 3485 Hammerberg Rd
- 1331 Sunset Blvd Unit 11
- 1151 Bristol Rd
- 00 Coolidge Dr
- 4436 Old Carriage Rd
- 4452 Old Carriage Rd
- 1420 Peachwood Dr
- 4460 Old Carriage Rd
- 4437 Old Carriage Rd
- 1428 Peachwood Dr
- 4453 Old Carriage Rd
- 4445 Old Carriage Rd
- 1412 Peachwood Dr
- 4461 Old Carriage Rd
- 1404 Peachwood Dr
- 4468 Old Carriage Rd
- 4476 Old Carriage Rd
- 4429 Old Carriage Rd
- 4469 Old Carriage Rd
- 4434 Ashlawn Dr
- 1396 Peachwood Dr
- 1480 Peachwood Dr
- 1466 Peachwood Dr
- 4426 Ashlawn Dr
Your Personal Tour Guide
Ask me questions while you tour the home.