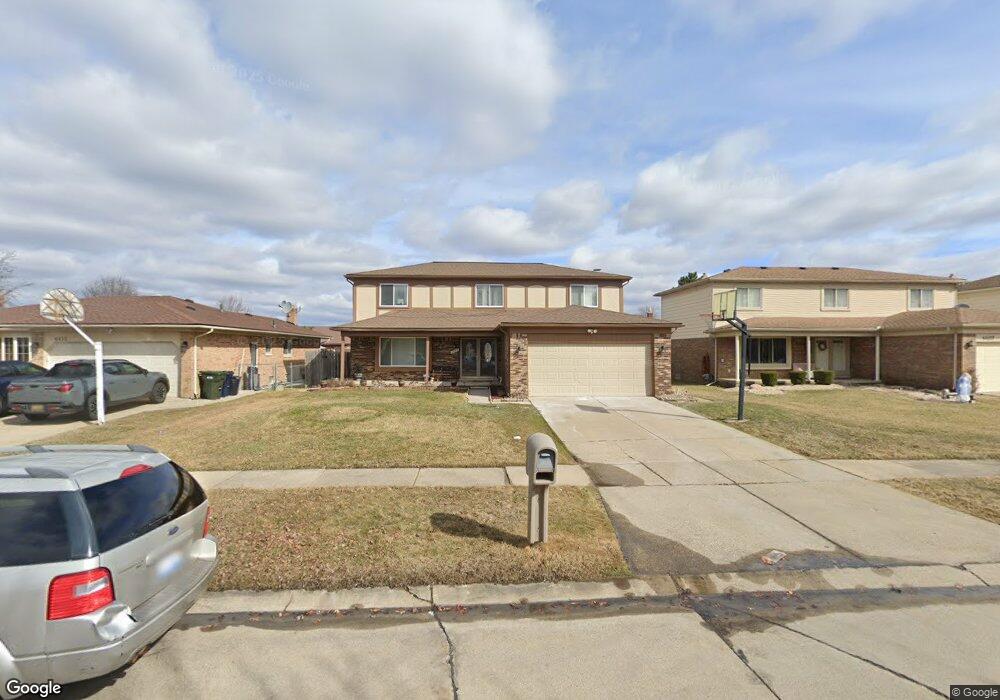
4445 Ardmore Dr Sterling Heights, MI 48310
Estimated Value: $378,713 - $420,000
4
Beds
3
Baths
2,384
Sq Ft
$168/Sq Ft
Est. Value
About This Home
This home is located at 4445 Ardmore Dr, Sterling Heights, MI 48310 and is currently estimated at $400,428, approximately $167 per square foot. 4445 Ardmore Dr is a home located in Macomb County with nearby schools including Jefferson Elementary School, Grissom Middle School, and Sterling Heights Senior H.S..
Ownership History
Date
Name
Owned For
Owner Type
Purchase Details
Closed on
Apr 30, 2020
Sold by
Georgis Maher Z
Bought by
Georgis Maher Z and Georgis Sherly
Current Estimated Value
Home Financials for this Owner
Home Financials are based on the most recent Mortgage that was taken out on this home.
Original Mortgage
$125,883
Outstanding Balance
$74,552
Interest Rate
3.2%
Mortgage Type
FHA
Estimated Equity
$325,876
Purchase Details
Closed on
Feb 27, 2009
Sold by
C Trott and Trott C
Bought by
Georgis Maher Z
Purchase Details
Closed on
Feb 21, 2008
Sold by
Mortgage Electronic Registration Systems
Bought by
Federal National Mortgage Association
Purchase Details
Closed on
Jan 18, 2008
Sold by
Shaouni Faiq and Shaouni Inaam
Bought by
Mortgage Electronic Registration Systems
Purchase Details
Closed on
Jan 31, 2005
Sold by
Jarbo Karim S and Jarbo Ban S
Bought by
Shaouni Faiq
Create a Home Valuation Report for This Property
The Home Valuation Report is an in-depth analysis detailing your home's value as well as a comparison with similar homes in the area
Home Values in the Area
Average Home Value in this Area
Purchase History
| Date | Buyer | Sale Price | Title Company |
|---|---|---|---|
| Georgis Maher Z | -- | Vylla Llc | |
| Georgis Maher Z | $160,000 | Warranty Title Agency Llc | |
| Federal National Mortgage Association | -- | None Available | |
| Mortgage Electronic Registration Systems | $219,182 | None Available | |
| Shaouni Faiq | $230,000 | Stewart Title |
Source: Public Records
Mortgage History
| Date | Status | Borrower | Loan Amount |
|---|---|---|---|
| Open | Georgis Maher Z | $125,883 |
Source: Public Records
Tax History Compared to Growth
Tax History
| Year | Tax Paid | Tax Assessment Tax Assessment Total Assessment is a certain percentage of the fair market value that is determined by local assessors to be the total taxable value of land and additions on the property. | Land | Improvement |
|---|---|---|---|---|
| 2025 | $4,286 | $182,400 | $0 | $0 |
| 2024 | $4,135 | $173,500 | $0 | $0 |
| 2023 | $3,925 | $155,400 | $0 | $0 |
| 2022 | $3,806 | $143,800 | $0 | $0 |
| 2021 | $3,934 | $134,300 | $0 | $0 |
| 2020 | $3,740 | $126,900 | $0 | $0 |
| 2019 | $3,687 | $121,700 | $0 | $0 |
| 2018 | $3,720 | $112,000 | $0 | $0 |
| 2017 | $3,586 | $105,200 | $13,700 | $91,500 |
| 2016 | $3,510 | $105,200 | $0 | $0 |
| 2015 | -- | $93,000 | $0 | $0 |
| 2014 | -- | $77,500 | $0 | $0 |
Source: Public Records
Map
Nearby Homes
- 4622 Ardmore Dr
- 38576 Cottonwood Dr
- 38915 Claremont Ct
- 4653 Lucerne Dr
- 38338 Coronation Dr
- 4325 Fox Hill Dr
- 4761 Fox Hill Dr
- 4768 Dreon Ct
- 3816 Pokley Ct
- 38638 Harrison Dr
- 38172 Yonkers Dr
- 38968 Harrison Dr
- 5118 Fredrick Dr
- 3600 Brandi Dr
- 3349 Dobbin Dr
- 3601 Denson Dr
- 5477 Victory Cir Unit 70
- 39198 Faith Dr
- 37683 Adrian Dr
- 37258 Carpathia Blvd
- 4457 Ardmore Dr
- 4433 Ardmore Dr
- 4440 Boulder Dr
- 4469 Ardmore Dr
- 4452 Boulder Dr
- 4428 Boulder Dr
- 4464 Boulder Dr
- 4416 Boulder Dr
- 4446 Ardmore Dr
- 4481 Ardmore Dr
- 4434 Ardmore Dr
- 4458 Ardmore Dr
- 4422 Ardmore Dr
- 4476 Boulder Dr
- 4470 Ardmore Dr
- 4493 Ardmore Dr
- 4410 Ardmore Dr
- 4488 Boulder Dr
- 4482 Ardmore Dr
- 38539 Claremont Dr