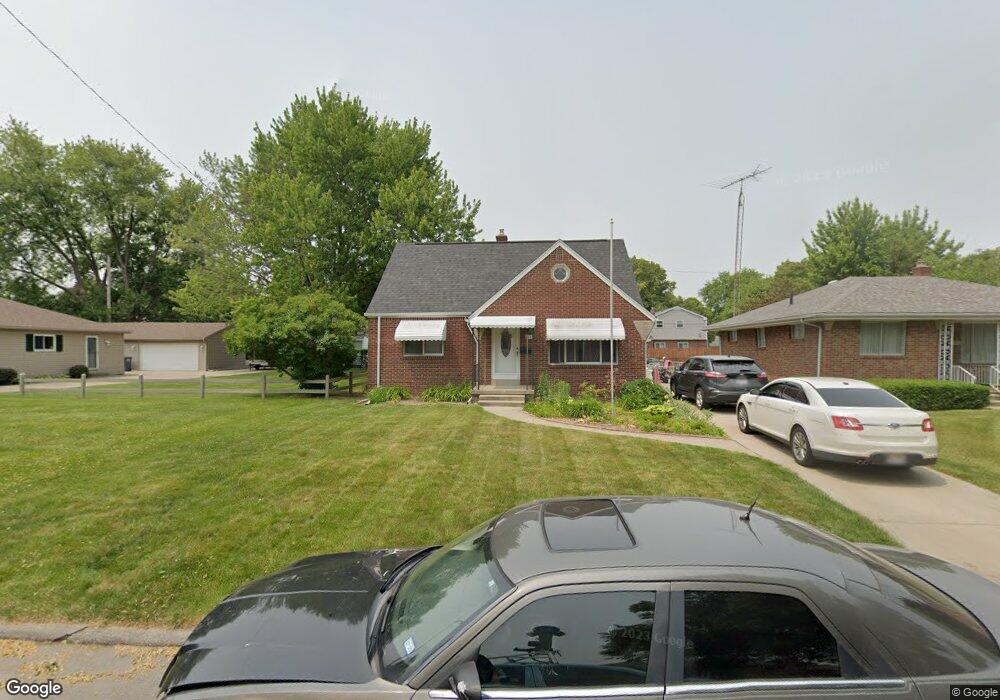
4447 283rd St Toledo, OH 43611
Point Place NeighborhoodEstimated Value: $162,000 - $185,000
3
Beds
2
Baths
1,446
Sq Ft
$121/Sq Ft
Est. Value
About This Home
This home is located at 4447 283rd St, Toledo, OH 43611 and is currently estimated at $174,284, approximately $120 per square foot. 4447 283rd St is a home located in Lucas County with nearby schools including Shoreland Elementary School, Washington Junior High School, and Jefferson Junior High School.
Ownership History
Date
Name
Owned For
Owner Type
Purchase Details
Closed on
Mar 29, 2018
Sold by
Sodon Michael J and Soden Michael L
Bought by
Mayo Steven A and Mayo Jennifer L
Current Estimated Value
Home Financials for this Owner
Home Financials are based on the most recent Mortgage that was taken out on this home.
Original Mortgage
$87,400
Outstanding Balance
$75,093
Interest Rate
4.4%
Mortgage Type
New Conventional
Estimated Equity
$99,191
Purchase Details
Closed on
Aug 30, 2017
Sold by
Soden Michael J and Soden Adrienne
Bought by
Mayo Steven and Mayo Jennifer
Purchase Details
Closed on
Sep 28, 2012
Sold by
Soden Michael J and Sodon Michael J
Bought by
Mayo Steven and Mayo Jennifer
Purchase Details
Closed on
Dec 29, 2006
Sold by
Ignatowski Charles
Bought by
Sodon Michael J
Home Financials for this Owner
Home Financials are based on the most recent Mortgage that was taken out on this home.
Original Mortgage
$95,600
Interest Rate
6.27%
Mortgage Type
Purchase Money Mortgage
Create a Home Valuation Report for This Property
The Home Valuation Report is an in-depth analysis detailing your home's value as well as a comparison with similar homes in the area
Home Values in the Area
Average Home Value in this Area
Purchase History
| Date | Buyer | Sale Price | Title Company |
|---|---|---|---|
| Mayo Steven A | $96,600 | Liberty Title Inc | |
| Mayo Steven | $96,522 | None Available | |
| Mayo Steven | $104,800 | None Available | |
| Sodon Michael J | $119,500 | Attorney |
Source: Public Records
Mortgage History
| Date | Status | Borrower | Loan Amount |
|---|---|---|---|
| Open | Mayo Steven A | $87,400 | |
| Closed | Sodon Michael J | $95,600 | |
| Closed | Mayo Steven | $0 |
Source: Public Records
Tax History Compared to Growth
Tax History
| Year | Tax Paid | Tax Assessment Tax Assessment Total Assessment is a certain percentage of the fair market value that is determined by local assessors to be the total taxable value of land and additions on the property. | Land | Improvement |
|---|---|---|---|---|
| 2024 | $1,324 | $43,295 | $7,175 | $36,120 |
| 2023 | $2,623 | $36,715 | $5,985 | $30,730 |
| 2022 | $2,617 | $36,715 | $5,985 | $30,730 |
| 2021 | $2,665 | $36,715 | $5,985 | $30,730 |
| 2020 | $2,712 | $32,200 | $4,830 | $27,370 |
| 2019 | $2,631 | $32,200 | $4,830 | $27,370 |
| 2018 | $2,773 | $36,820 | $4,830 | $31,990 |
| 2017 | $2,842 | $35,980 | $4,725 | $31,255 |
| 2016 | $2,830 | $102,800 | $13,500 | $89,300 |
| 2015 | $2,818 | $102,800 | $13,500 | $89,300 |
| 2014 | $2,452 | $35,990 | $4,730 | $31,260 |
| 2013 | $2,452 | $35,990 | $4,730 | $31,260 |
Source: Public Records
Map
Nearby Homes
- 2150 Hoops Dr
- 4492 283rd St
- 4314 Dahlia Dr
- 4441 290th St
- 4252 289th St
- 2434 Roseann Dr
- 2532 102nd St
- 4828 287th St
- 2730 109th St
- 4811 298th St
- 3529 Willow Brook Ln
- 3533 Willow Brook Ln
- 2240 Ruthanne Dr
- 4755 301st St
- 3628 Terrace Dr
- 3631 Terrace Dr
- 2641 117th St
- 2849 N 109th St
- 2938 S 109th St
- 3519 Terrace Dr