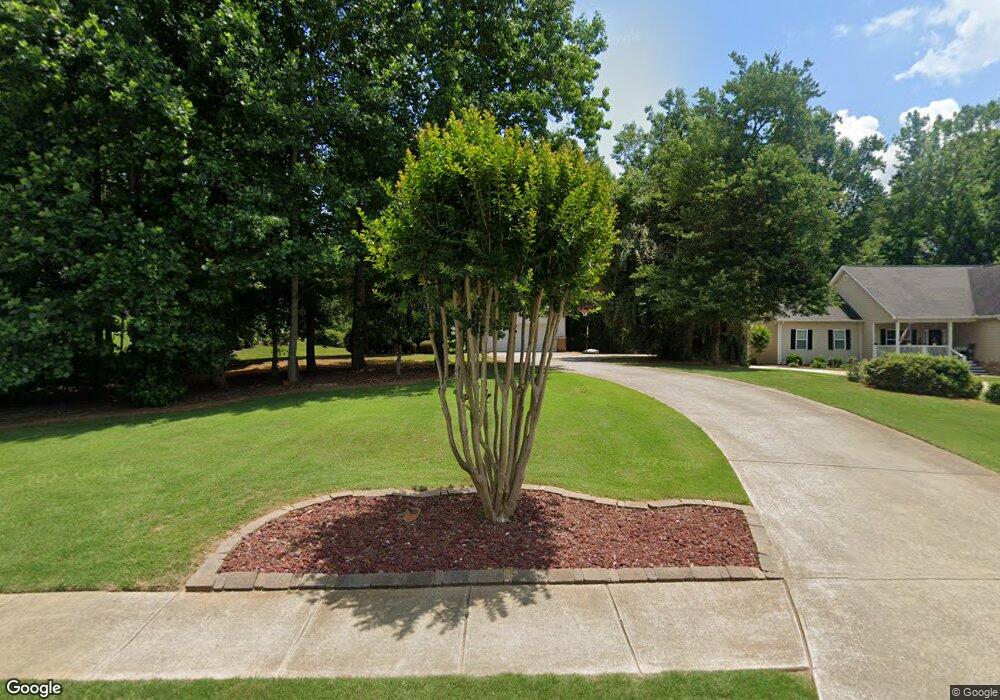
4447 Enfield Dr Unit 2 Gainesville, GA 30506
Estimated Value: $399,149 - $475,000
3
Beds
3
Baths
2,482
Sq Ft
$177/Sq Ft
Est. Value
About This Home
This home is located at 4447 Enfield Dr Unit 2, Gainesville, GA 30506 and is currently estimated at $439,287, approximately $176 per square foot. 4447 Enfield Dr Unit 2 is a home located in Hall County with nearby schools including Lanier Elementary School, Chestatee Middle School, and Chestatee High School.
Ownership History
Date
Name
Owned For
Owner Type
Purchase Details
Closed on
Apr 9, 2008
Sold by
Moore Derek N
Bought by
Moore Derek N and Moore Amy J
Current Estimated Value
Home Financials for this Owner
Home Financials are based on the most recent Mortgage that was taken out on this home.
Original Mortgage
$5,500
Interest Rate
6.03%
Mortgage Type
New Conventional
Purchase Details
Closed on
Jun 25, 2004
Sold by
Lanier Custom Homes Inc
Bought by
Moore Derek N
Home Financials for this Owner
Home Financials are based on the most recent Mortgage that was taken out on this home.
Original Mortgage
$37,100
Interest Rate
5.4%
Mortgage Type
New Conventional
Purchase Details
Closed on
May 7, 2003
Sold by
Highway 53 Properties Inc
Bought by
Dc&L Sardis Llc
Create a Home Valuation Report for This Property
The Home Valuation Report is an in-depth analysis detailing your home's value as well as a comparison with similar homes in the area
Home Values in the Area
Average Home Value in this Area
Purchase History
| Date | Buyer | Sale Price | Title Company |
|---|---|---|---|
| Moore Derek N | -- | -- | |
| Moore Derek N | $185,700 | -- | |
| Dc&L Sardis Llc | $198,000 | -- |
Source: Public Records
Mortgage History
| Date | Status | Borrower | Loan Amount |
|---|---|---|---|
| Closed | Moore Derek N | $5,500 | |
| Open | Moore Derek N | $186,000 | |
| Previous Owner | Moore Derek N | $37,100 | |
| Previous Owner | Moore Derek N | $148,500 |
Source: Public Records
Tax History Compared to Growth
Tax History
| Year | Tax Paid | Tax Assessment Tax Assessment Total Assessment is a certain percentage of the fair market value that is determined by local assessors to be the total taxable value of land and additions on the property. | Land | Improvement |
|---|---|---|---|---|
| 2024 | $4,078 | $160,360 | $27,320 | $133,040 |
| 2023 | $3,403 | $148,800 | $29,560 | $119,240 |
| 2022 | $3,750 | $141,200 | $28,480 | $112,720 |
| 2021 | $2,823 | $103,240 | $12,400 | $90,840 |
| 2020 | $2,775 | $98,560 | $12,400 | $86,160 |
| 2019 | $2,665 | $93,680 | $12,400 | $81,280 |
| 2018 | $2,661 | $90,640 | $10,360 | $80,280 |
| 2017 | $2,401 | $82,280 | $10,360 | $71,920 |
| 2016 | $2,346 | $82,280 | $10,360 | $71,920 |
| 2015 | $2,057 | $88,040 | $8,280 | $79,760 |
| 2014 | $2,057 | $71,160 | $6,720 | $64,440 |
Source: Public Records
Map
Nearby Homes
- 4606 Enfield Dr
- 4506 Old Princeton Ridge Unit 1
- 4522 Old Princeton Ridge
- 4135 Cha Co Rd
- 4704 Hanson Hills Ct
- 4722 Middleboro Ln
- 4409 Waterman Dr
- 4340 Oak Creek Dr
- 4363 Sardis Rd
- 4232 Green Valley Dr
- 3286 High View Ct
- 3292 High View Ct
- 4466 Sardis Dr
- 3834 Covered Bridge Place
- 4051 Hidden Hollow Dr Unit A
- 4033 Hidden Hollow Dr
- 4443 Enfield Dr
- 4451 Enfield Dr
- 4455 Enfield Dr Unit 2
- 4446 Enfield Dr
- 4450 Enfield Dr
- 4518 Yearling Ct
- 4442 Enfield Dr
- 4459 Enfield Dr Unit 2
- 4454 Enfield Dr
- 4427 Enfield Dr
- 4515 Yearling Ct
- 0 Yearling Ct Unit 7467237
- 0 Yearling Ct Unit 7414530
- 0 Yearling Ct Unit 8600823
- 0 Yearling Ct
- 0 Enfield Dr Unit 2922954
- 0 Enfield Dr Unit 2922952
- 0 Enfield Dr Unit 2922945
- 0 Enfield Dr Unit 8669768
- 0 Enfield Dr Unit 8105859