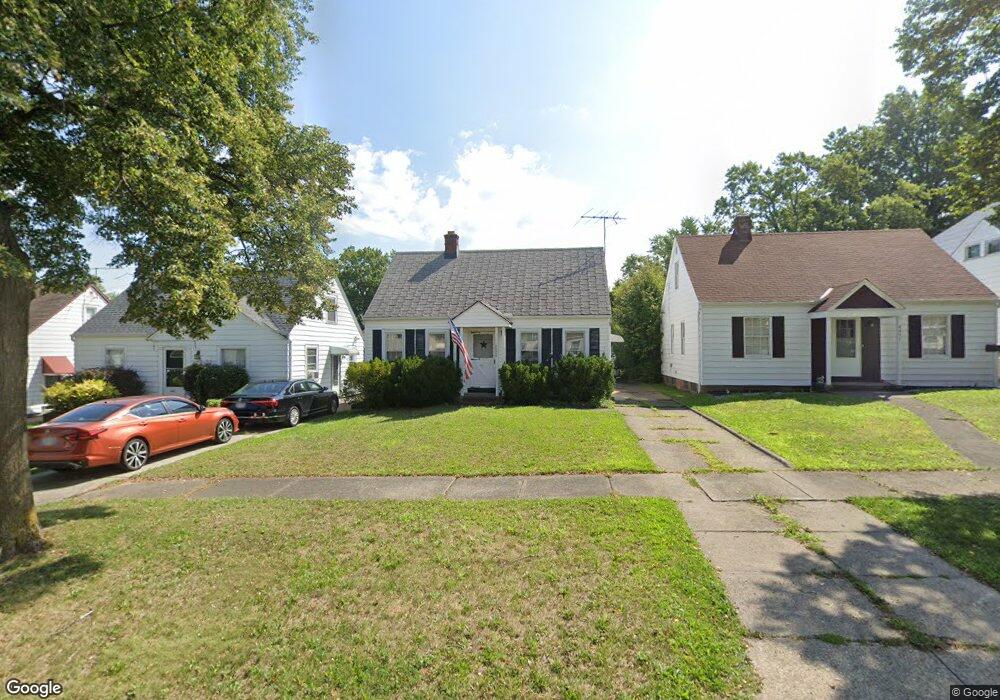
4447 W 56th St Cleveland, OH 44144
Old Brooklyn NeighborhoodEstimated Value: $138,000 - $151,000
2
Beds
1
Bath
900
Sq Ft
$160/Sq Ft
Est. Value
About This Home
This home is located at 4447 W 56th St, Cleveland, OH 44144 and is currently estimated at $144,028, approximately $160 per square foot. 4447 W 56th St is a home located in Cuyahoga County with nearby schools including Benjamin Franklin, Almira Academy, and Artemus Ward School.
Ownership History
Date
Name
Owned For
Owner Type
Purchase Details
Closed on
Oct 25, 2006
Sold by
Flack Mary A and Flack Richard F
Bought by
Bartholomew David
Current Estimated Value
Home Financials for this Owner
Home Financials are based on the most recent Mortgage that was taken out on this home.
Original Mortgage
$74,500
Outstanding Balance
$44,782
Interest Rate
6.5%
Mortgage Type
Purchase Money Mortgage
Estimated Equity
$99,246
Purchase Details
Closed on
Mar 26, 2001
Sold by
Flack Mary A and Flack Richard F
Bought by
Flack Mary A and Flack Richard F
Purchase Details
Closed on
Jun 22, 1993
Sold by
Flack Mary A
Bought by
Flack Mary A
Purchase Details
Closed on
Dec 5, 1983
Sold by
Flack Frank J
Bought by
Flack Mary A
Purchase Details
Closed on
Aug 20, 1979
Sold by
Krause Bernard A
Bought by
Flack Frank J
Purchase Details
Closed on
Apr 19, 1979
Sold by
Schafer Robert L and Schafer Sally E
Bought by
Krause Bernard A
Purchase Details
Closed on
Jan 1, 1975
Bought by
Schafer Robert L and Schafer Sally E
Create a Home Valuation Report for This Property
The Home Valuation Report is an in-depth analysis detailing your home's value as well as a comparison with similar homes in the area
Home Values in the Area
Average Home Value in this Area
Purchase History
| Date | Buyer | Sale Price | Title Company |
|---|---|---|---|
| Bartholomew David | $74,500 | City Title Agency | |
| Flack Mary A | -- | -- | |
| Flack Mary A | -- | -- | |
| Flack Mary A | -- | -- | |
| Flack Frank J | $47,500 | -- | |
| Krause Bernard A | $40,500 | -- | |
| Schafer Robert L | -- | -- |
Source: Public Records
Mortgage History
| Date | Status | Borrower | Loan Amount |
|---|---|---|---|
| Open | Bartholomew David | $74,500 |
Source: Public Records
Tax History Compared to Growth
Tax History
| Year | Tax Paid | Tax Assessment Tax Assessment Total Assessment is a certain percentage of the fair market value that is determined by local assessors to be the total taxable value of land and additions on the property. | Land | Improvement |
|---|---|---|---|---|
| 2024 | $2,671 | $40,740 | $9,170 | $31,570 |
| 2023 | $2,723 | $28,070 | $6,580 | $21,490 |
| 2022 | $2,117 | $28,070 | $6,580 | $21,490 |
| 2021 | $2,096 | $28,070 | $6,580 | $21,490 |
| 2020 | $1,880 | $21,770 | $5,110 | $16,660 |
| 2019 | $1,738 | $62,200 | $14,600 | $47,600 |
| 2018 | $1,705 | $21,770 | $5,110 | $16,660 |
| 2017 | $1,692 | $20,520 | $4,450 | $16,070 |
| 2016 | $1,679 | $20,520 | $4,450 | $16,070 |
| 2015 | $1,872 | $20,520 | $4,450 | $16,070 |
| 2014 | $1,872 | $22,790 | $4,940 | $17,850 |
Source: Public Records
Map
Nearby Homes
- 4464 W 53rd St
- 4484 W 53rd St
- 4456 W 49th St
- 4373 W 52nd St
- 4427 W 49th St
- 5000 Behrwald Ave
- 5105 Behrwald Ave
- 4811 Ardmore Ave
- 4615 Ardmore Ave
- 4520 Wichita Ave
- 4510 Woburn Ave
- 5714 Stickney Ave
- 5701 Stickney Ave
- 4329 Ardmore Ave
- 4215 W 58th St
- 5902 Vandalia Ave
- 6015 Ira Ave
- 4581 Pearl Rd
- 4102 Spokane Ave
- 4140 W 49th St