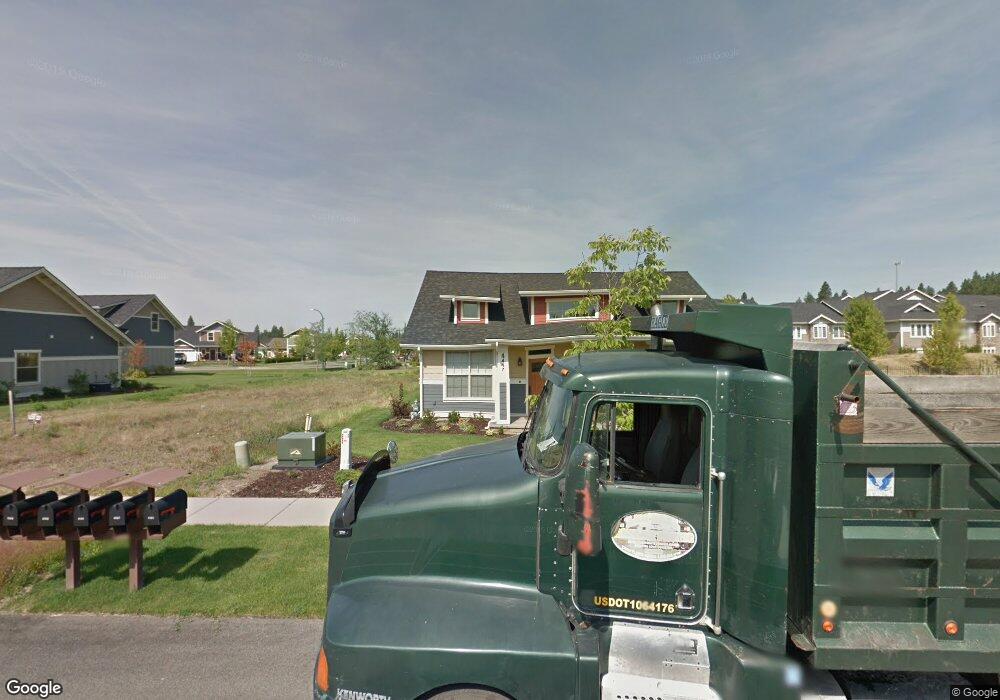
4447 W Woodhaven Loop Coeur D Alene, ID 83814
Spokane River District NeighborhoodEstimated Value: $786,000 - $874,000
3
Beds
2
Baths
1,844
Sq Ft
$451/Sq Ft
Est. Value
About This Home
This home is located at 4447 W Woodhaven Loop, Coeur D Alene, ID 83814 and is currently estimated at $831,962, approximately $451 per square foot. 4447 W Woodhaven Loop is a home located in Kootenai County with nearby schools including Winton Elementary School, Lakes Magnet Middle School, and Lake City High School.
Ownership History
Date
Name
Owned For
Owner Type
Purchase Details
Closed on
Sep 10, 2025
Sold by
Bell Alan M and Solmonson Paula J
Bought by
Bell Solmonson Family Trust and Bell
Current Estimated Value
Purchase Details
Closed on
Dec 1, 2020
Sold by
Campbell Malcolm S and Campbell Sandra J
Bought by
Bell Alan M and Solmonson Paula J
Home Financials for this Owner
Home Financials are based on the most recent Mortgage that was taken out on this home.
Original Mortgage
$396,000
Interest Rate
2.7%
Mortgage Type
New Conventional
Purchase Details
Closed on
Dec 28, 2009
Sold by
The Lighthouse Group Inc
Bought by
Campbell Malcolm S and Campbell Sandra J
Home Financials for this Owner
Home Financials are based on the most recent Mortgage that was taken out on this home.
Original Mortgage
$279,000
Interest Rate
4.88%
Mortgage Type
New Conventional
Purchase Details
Closed on
Aug 31, 2009
Sold by
Neighborhood Inc
Bought by
The Lighhouse Group Inc
Create a Home Valuation Report for This Property
The Home Valuation Report is an in-depth analysis detailing your home's value as well as a comparison with similar homes in the area
Home Values in the Area
Average Home Value in this Area
Purchase History
| Date | Buyer | Sale Price | Title Company |
|---|---|---|---|
| Bell Solmonson Family Trust | -- | None Listed On Document | |
| Bell Alan M | -- | Pioneer Title Kootenai Cnty | |
| Campbell Malcolm S | -- | -- | |
| The Lighhouse Group Inc | -- | -- |
Source: Public Records
Mortgage History
| Date | Status | Borrower | Loan Amount |
|---|---|---|---|
| Previous Owner | Bell Alan M | $396,000 | |
| Previous Owner | Campbell Malcolm S | $279,000 |
Source: Public Records
Tax History Compared to Growth
Tax History
| Year | Tax Paid | Tax Assessment Tax Assessment Total Assessment is a certain percentage of the fair market value that is determined by local assessors to be the total taxable value of land and additions on the property. | Land | Improvement |
|---|---|---|---|---|
| 2025 | $2,921 | $730,250 | $290,000 | $440,250 |
| 2024 | $2,899 | $722,340 | $280,000 | $442,340 |
| 2023 | $2,899 | $820,997 | $330,000 | $490,997 |
| 2022 | $3,728 | $844,614 | $331,500 | $513,114 |
| 2021 | $4,682 | $555,360 | $195,000 | $360,360 |
| 2020 | $3,311 | $381,020 | $149,500 | $231,520 |
| 2019 | $3,681 | $348,620 | $130,000 | $218,620 |
| 2018 | $4,013 | $340,915 | $130,000 | $210,915 |
| 2017 | $4,239 | $331,181 | $130,000 | $201,181 |
| 2016 | $4,328 | $321,216 | $130,000 | $191,216 |
| 2015 | $4,036 | $290,211 | $115,920 | $174,291 |
| 2013 | $4,107 | $270,190 | $110,400 | $159,790 |
Source: Public Records
Map
Nearby Homes
- 4445 Greenchain Loop Unit 2
- 4467 Greenchain Loop Unit 1
- 4444 Greenchain Loop Unit 3
- 4580 Greenchain Loop Unit 1
- 4539 Greenchain Loop Unit 5
- 4583 Greenchain Loop Unit 6
- 4083 W Shoreview Ln
- Ash Plan at Grand Mill
- Onyx Plan at Grand Mill
- 3276 N Grandmill Ln Unit 101
- 3276 N Grandmill Ln Unit 103
- 3226 N Grandmill Ln Unit 103
- 3222 N Grandmill Ln Unit 103
- 3222 N Grandmill Ln Unit 101
- 3222 N Grandmill Ln Unit 102
- 3990 W Shoreview Ln
- 3922 W Shoreview Ln
- Riverfront at Shoreview Lane Plan at Riverfront at Shoreview Lane
- 4708 Kona
- 4752 Kona
- 4463 W Woodhaven Loop
- 4429 W Woodhaven Loop
- 4413 W Woodhaven Loop
- 4483 W Woodhaven Loop
- 4413 Woodhaven
- 4449 W Greenchain Loop #3
- 4449 Greenchain Loop Unit 8
- 4449 Greenchain Loop Unit 6
- 4449 Greenchain Loop Unit 2
- 4449 Greenchain Loop Unit 7
- 4449 Greenchain Loop Unit 5
- 4449 Greenchain Loop Unit 3
- 4449 Greenchain Loop
- 4449 Greenchain Loop Unit 7
- 4464 W Woodhaven Loop
- 4395 W Woodhaven Loop
- 4448 W Woodhaven Loop
- 4432 W Woodhaven Loop
- 4414 W Woodhaven Loop
- 4301 W Shoreview Ln