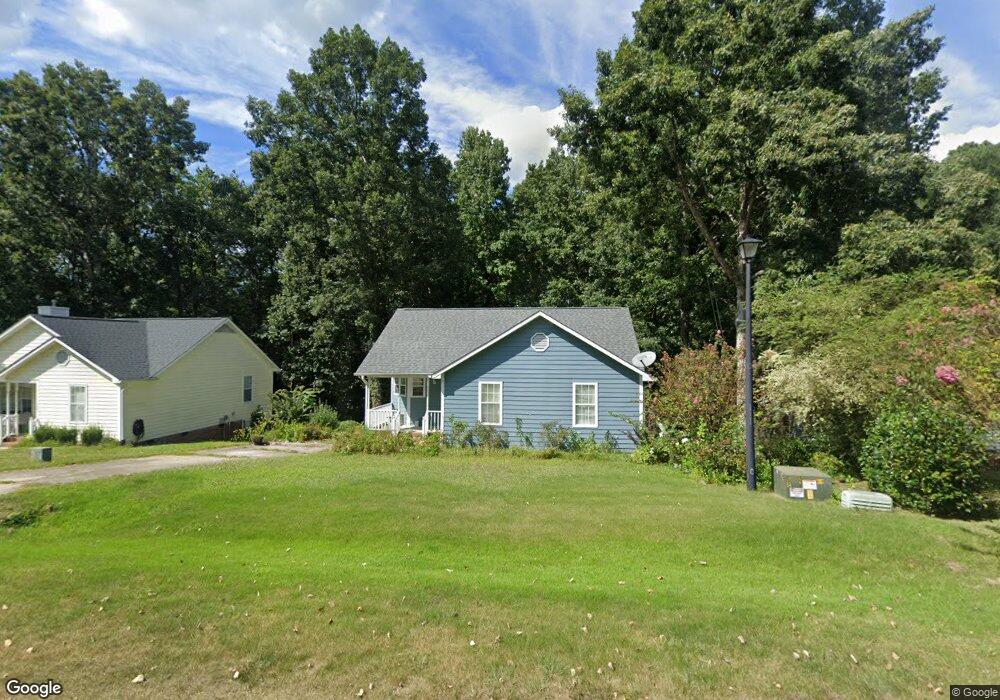
4449 Labrador Dr Raleigh, NC 27616
Estimated Value: $293,000 - $300,000
3
Beds
2
Baths
1,265
Sq Ft
$234/Sq Ft
Est. Value
About This Home
This home is located at 4449 Labrador Dr, Raleigh, NC 27616 and is currently estimated at $296,497, approximately $234 per square foot. 4449 Labrador Dr is a home located in Wake County with nearby schools including Forestville Road Elementary School, Neuse River Middle School, and Knightdale High.
Ownership History
Date
Name
Owned For
Owner Type
Purchase Details
Closed on
Sep 23, 2003
Sold by
Arnold Steven B and Arnold Marion
Bought by
Mira Erica and Mira Eugenio M
Current Estimated Value
Home Financials for this Owner
Home Financials are based on the most recent Mortgage that was taken out on this home.
Original Mortgage
$103,050
Outstanding Balance
$48,101
Interest Rate
6.33%
Mortgage Type
Purchase Money Mortgage
Estimated Equity
$248,396
Purchase Details
Closed on
Aug 30, 2001
Sold by
Maddox Wanda K
Bought by
Arnold Steven B and Arnold Marion
Home Financials for this Owner
Home Financials are based on the most recent Mortgage that was taken out on this home.
Original Mortgage
$106,981
Interest Rate
7.08%
Mortgage Type
FHA
Purchase Details
Closed on
Nov 24, 1998
Sold by
Grabowski Sandra Marie and Andrews Sandra M
Bought by
Maddox Wanda K
Home Financials for this Owner
Home Financials are based on the most recent Mortgage that was taken out on this home.
Original Mortgage
$89,205
Interest Rate
6.47%
Create a Home Valuation Report for This Property
The Home Valuation Report is an in-depth analysis detailing your home's value as well as a comparison with similar homes in the area
Home Values in the Area
Average Home Value in this Area
Purchase History
| Date | Buyer | Sale Price | Title Company |
|---|---|---|---|
| Mira Erica | $114,500 | -- | |
| Arnold Steven B | $109,000 | -- | |
| Maddox Wanda K | $94,000 | -- |
Source: Public Records
Mortgage History
| Date | Status | Borrower | Loan Amount |
|---|---|---|---|
| Open | Mira Erica | $103,050 | |
| Previous Owner | Arnold Steven B | $106,981 | |
| Previous Owner | Maddox Wanda K | $89,205 |
Source: Public Records
Tax History Compared to Growth
Tax History
| Year | Tax Paid | Tax Assessment Tax Assessment Total Assessment is a certain percentage of the fair market value that is determined by local assessors to be the total taxable value of land and additions on the property. | Land | Improvement |
|---|---|---|---|---|
| 2025 | $1,764 | $272,647 | $80,000 | $192,647 |
| 2024 | $1,713 | $272,647 | $80,000 | $192,647 |
| 2023 | $1,356 | $171,378 | $35,000 | $136,378 |
| 2022 | $1,258 | $171,378 | $35,000 | $136,378 |
| 2021 | $1,224 | $171,378 | $35,000 | $136,378 |
| 2020 | $1,204 | $171,378 | $35,000 | $136,378 |
| 2019 | $1,102 | $132,481 | $38,000 | $94,481 |
| 2018 | $1,014 | $132,481 | $38,000 | $94,481 |
| 2017 | $962 | $132,481 | $38,000 | $94,481 |
| 2016 | $943 | $132,481 | $38,000 | $94,481 |
| 2015 | $904 | $127,319 | $28,000 | $99,319 |
| 2014 | $858 | $127,319 | $28,000 | $99,319 |
Source: Public Records
Map
Nearby Homes
- 4457 Labrador Dr
- 2224 Bufflehead Rd
- 2028 Ruddy Rd
- 2205 Bufflehead Rd
- 4208 Bluewing Rd
- 4356 Coldwater Springs Dr
- 4348 Coldwater Springs Dr
- 4344 Coldwater Springs Dr
- 4345 Coldwater Springs Dr
- 4340 Coldwater Springs Dr
- 4332 Coldwater Springs Dr
- 4341 Coldwater Springs Dr
- 2616 Lizei St
- 4004 Mount Moran Rd
- 3932 Mount Moran Rd
- 7817 Elmshire Way
- 7727 Weathered Oak Way
- 7725 Weathered Oak Way
- 7661 Mapleshire Dr
- 4613 Cherrybark Ln
- 4445 Labrador Dr
- 4453 Labrador Dr
- 4441 Labrador Dr
- 4452 Labrador Dr
- 4448 Labrador Dr
- 4456 Labrador Dr
- 4444 Labrador Dr
- 4501 Labrador Dr
- 4437 Labrador Dr
- 4436 Labrador Dr
- 4505 Labrador Dr
- 4500 Labrador Dr
- 4433 Labrador Dr
- 4401 Baldpate Ct
- 4428 Labrador Dr
- 4529 Whistling Way
- 4405 Baldpate Ct
- 4536 Whistling Way
- 4504 Labrador Dr
- 4509 Labrador Dr