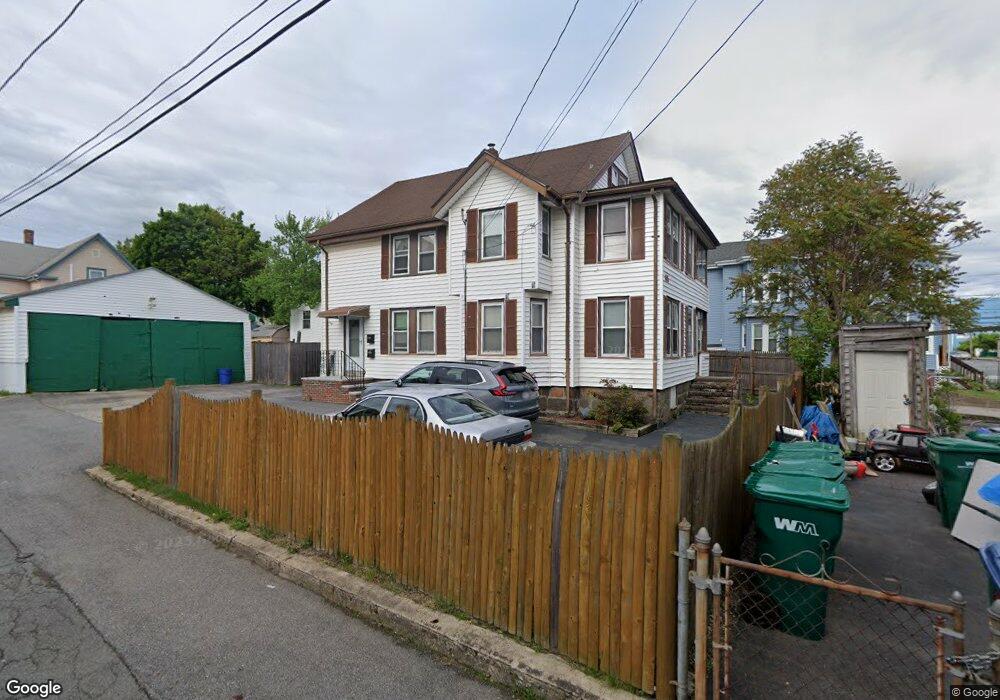
445 Boston St Lynn, MA 01905
Lower Boston Street NeighborhoodEstimated Value: $604,000 - $870,000
5
Beds
3
Baths
2,736
Sq Ft
$266/Sq Ft
Est. Value
About This Home
This home is located at 445 Boston St, Lynn, MA 01905 and is currently estimated at $727,103, approximately $265 per square foot. 445 Boston St is a home located in Essex County with nearby schools including North Park Elementary School, William R. Fallon School, and Tracy Elementary School.
Ownership History
Date
Name
Owned For
Owner Type
Purchase Details
Closed on
Jan 13, 2010
Sold by
Morrill David C
Bought by
Morrill Josephine A
Current Estimated Value
Home Financials for this Owner
Home Financials are based on the most recent Mortgage that was taken out on this home.
Original Mortgage
$403,500
Outstanding Balance
$261,676
Interest Rate
4.71%
Mortgage Type
Reverse Mortgage Home Equity Conversion Mortgage
Estimated Equity
$465,427
Create a Home Valuation Report for This Property
The Home Valuation Report is an in-depth analysis detailing your home's value as well as a comparison with similar homes in the area
Home Values in the Area
Average Home Value in this Area
Purchase History
| Date | Buyer | Sale Price | Title Company |
|---|---|---|---|
| Morrill Josephine A | $90,000 | -- | |
| Morrill Josephine A | $90,000 | -- |
Source: Public Records
Mortgage History
| Date | Status | Borrower | Loan Amount |
|---|---|---|---|
| Open | Morrill Josephine A | $403,500 | |
| Closed | Morrill Josephine A | $403,500 | |
| Previous Owner | Morrill Josephine A | $12,000 |
Source: Public Records
Tax History Compared to Growth
Tax History
| Year | Tax Paid | Tax Assessment Tax Assessment Total Assessment is a certain percentage of the fair market value that is determined by local assessors to be the total taxable value of land and additions on the property. | Land | Improvement |
|---|---|---|---|---|
| 2025 | $7,733 | $746,398 | $206,900 | $539,498 |
| 2024 | $7,292 | $692,500 | $192,400 | $500,100 |
| 2023 | $7,565 | $678,500 | $212,800 | $465,700 |
| 2022 | $7,412 | $596,300 | $163,000 | $433,300 |
| 2021 | $6,879 | $527,900 | $140,800 | $387,100 |
| 2020 | $6,563 | $489,800 | $144,400 | $345,400 |
| 2019 | $6,292 | $440,000 | $129,000 | $311,000 |
| 2018 | $5,759 | $380,100 | $116,400 | $263,700 |
| 2017 | $5,516 | $353,600 | $101,900 | $251,700 |
| 2016 | $5,131 | $317,100 | $93,700 | $223,400 |
| 2015 | $4,953 | $295,700 | $96,400 | $199,300 |
Source: Public Records
Map
Nearby Homes
- 439 Boston St
- 19 Sargents Ct
- 14 Sargents Ct
- 8 Sargents Ct
- 4 Sargents Ct
- 6 Sargents Ct
- 4 Sargents Ct Unit 3
- 6 Sargents Ct Unit 3
- 18 Sargents Ct
- 6 N Federal St
- 14 N Federal St
- 25 Sargents Ct
- 435 Boston St
- 20 Sargents Ct
- 2 Sargents Ct
- 18 N Federal St
- 18 N Federal St Unit 2
- 18 N Federal St Unit 1
- 18 N Federal St Unit 3
- 24 Sargents Ct