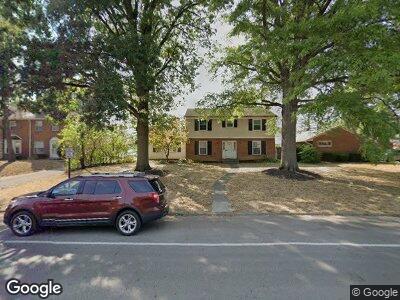
445 Eastmoor Blvd Columbus, OH 43209
Eastmoor NeighborhoodEstimated Value: $454,756 - $506,000
4
Beds
3
Baths
2,172
Sq Ft
$222/Sq Ft
Est. Value
About This Home
This home is located at 445 Eastmoor Blvd, Columbus, OH 43209 and is currently estimated at $482,189, approximately $222 per square foot. 445 Eastmoor Blvd is a home located in Franklin County with nearby schools including Fairmoor Elementary School, Johnson Park Middle School, and Walnut Ridge High School.
Ownership History
Date
Name
Owned For
Owner Type
Purchase Details
Closed on
Dec 26, 2000
Sold by
Shkolnik Alisa A
Bought by
Shkolnik Todd J
Current Estimated Value
Home Financials for this Owner
Home Financials are based on the most recent Mortgage that was taken out on this home.
Original Mortgage
$134,000
Interest Rate
5.75%
Purchase Details
Closed on
Jan 15, 1999
Sold by
Levine Dana B
Bought by
Shkolnik Todd J and Shkolnik Alisa A
Home Financials for this Owner
Home Financials are based on the most recent Mortgage that was taken out on this home.
Original Mortgage
$131,550
Interest Rate
6.79%
Purchase Details
Closed on
Oct 29, 1990
Bought by
Levine Dana B
Purchase Details
Closed on
Oct 7, 1988
Create a Home Valuation Report for This Property
The Home Valuation Report is an in-depth analysis detailing your home's value as well as a comparison with similar homes in the area
Home Values in the Area
Average Home Value in this Area
Purchase History
| Date | Buyer | Sale Price | Title Company |
|---|---|---|---|
| Shkolnik Todd J | -- | -- | |
| Shkolnik Todd J | $138,500 | Hummel Title Agency Inc | |
| Levine Dana B | -- | -- | |
| -- | $39,300 | -- |
Source: Public Records
Mortgage History
| Date | Status | Borrower | Loan Amount |
|---|---|---|---|
| Open | Shkolnik Todd J | $106,000 | |
| Closed | Shkolnik Todd J | $149,000 | |
| Closed | Shkolnik Todd J | $36,125 | |
| Closed | Shkolnik Todd | $30,000 | |
| Closed | Shkolnik Todd | $15,000 | |
| Closed | Shkolnik Todd | $147,000 | |
| Closed | Shkolnik Todd J | $15,000 | |
| Closed | Shkolnik Todd J | $134,000 | |
| Closed | Shkolnik Todd J | $131,550 |
Source: Public Records
Tax History Compared to Growth
Tax History
| Year | Tax Paid | Tax Assessment Tax Assessment Total Assessment is a certain percentage of the fair market value that is determined by local assessors to be the total taxable value of land and additions on the property. | Land | Improvement |
|---|---|---|---|---|
| 2024 | $5,975 | $133,140 | $51,030 | $82,110 |
| 2023 | $5,899 | $133,140 | $51,030 | $82,110 |
| 2022 | $4,927 | $95,000 | $37,420 | $57,580 |
| 2021 | $4,936 | $95,000 | $37,420 | $57,580 |
| 2020 | $4,942 | $95,000 | $37,420 | $57,580 |
| 2019 | $4,448 | $73,330 | $29,960 | $43,370 |
| 2018 | $4,257 | $73,330 | $29,960 | $43,370 |
| 2017 | $4,467 | $73,330 | $29,960 | $43,370 |
| 2016 | $4,489 | $67,760 | $27,440 | $40,320 |
| 2015 | $4,075 | $67,760 | $27,440 | $40,320 |
| 2014 | $4,085 | $67,760 | $27,440 | $40,320 |
| 2013 | $2,015 | $67,760 | $27,440 | $40,320 |
Source: Public Records
Map
Nearby Homes
- 432 S Chesterfield Rd
- 3120 Kellner Place
- 3129 Fair Ave
- 300 S Virginialee Rd
- 560 S Kellner Rd
- 616 Eastmoor Blvd Unit 478
- 603 S James Rd
- 2887 Bryden Rd
- 2938 Sherwood Rd
- 668 Enfield Rd
- 568 S Everett Ave
- 170 S Broadleigh Rd
- 723-725 S Chesterfield Rd
- 109 S Broadleigh Rd
- 2760 Powell Ave
- 3175 Medway Ave
- 773 S Chesterfield Rd
- 152 S Stanwood Rd
- 136 S Remington Rd
- 204 S Cassingham Rd
- 445 Eastmoor Blvd
- 435 Eastmoor Blvd
- 455 Eastmoor Blvd
- 3010 Fair Ave
- 2999 Plymouth Ave
- 3000 Fair Ave
- 417 Eastmoor Blvd
- 2992 Fair Ave
- 448 Eastmoor Blvd
- 456-468 Eastmoor Blvd Unit 4
- 456 Eastmoor Blvd
- 2984 Fair Ave
- 436 Eastmoor Blvd
- 3010 Plymouth Ave
- 403 Eastmoor Blvd
- 430 Eastmoor Blvd
- 2980 Fair Ave
- 3002 Plymouth Ave
- 2983 Plymouth Ave
- 2987 Fair Ave