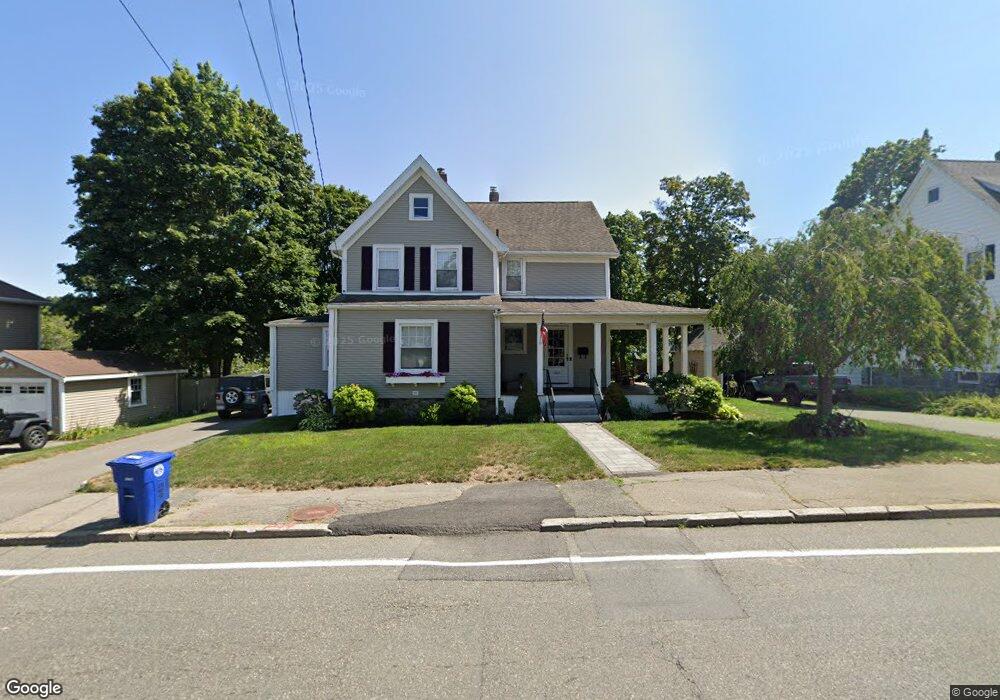
445 Elm St Braintree, MA 02184
East Braintree NeighborhoodEstimated Value: $660,000 - $795,000
3
Beds
2
Baths
2,054
Sq Ft
$364/Sq Ft
Est. Value
About This Home
This home is located at 445 Elm St, Braintree, MA 02184 and is currently estimated at $748,145, approximately $364 per square foot. 445 Elm St is a home located in Norfolk County with nearby schools including Braintree High School, Meeting House Montessori School, and Sacred Heart Elementary School.
Ownership History
Date
Name
Owned For
Owner Type
Purchase Details
Closed on
Jun 21, 1994
Sold by
Arthur Norman T and Arthur Jean F
Bought by
Cavanaugh Michael J and Cavanaugh Nancy J
Current Estimated Value
Create a Home Valuation Report for This Property
The Home Valuation Report is an in-depth analysis detailing your home's value as well as a comparison with similar homes in the area
Home Values in the Area
Average Home Value in this Area
Purchase History
| Date | Buyer | Sale Price | Title Company |
|---|---|---|---|
| Cavanaugh Michael J | $135,000 | -- |
Source: Public Records
Mortgage History
| Date | Status | Borrower | Loan Amount |
|---|---|---|---|
| Open | Cavanaugh Michael J | $25,000 | |
| Closed | Cavanaugh Michael J | $20,000 |
Source: Public Records
Tax History Compared to Growth
Tax History
| Year | Tax Paid | Tax Assessment Tax Assessment Total Assessment is a certain percentage of the fair market value that is determined by local assessors to be the total taxable value of land and additions on the property. | Land | Improvement |
|---|---|---|---|---|
| 2025 | $7,012 | $702,600 | $363,100 | $339,500 |
| 2024 | $6,353 | $670,200 | $335,600 | $334,600 |
| 2023 | $6,088 | $623,800 | $308,100 | $315,700 |
| 2022 | $5,988 | $601,800 | $286,100 | $315,700 |
| 2021 | $5,580 | $560,800 | $264,000 | $296,800 |
| 2020 | $5,399 | $547,600 | $264,000 | $283,600 |
| 2019 | $5,345 | $529,700 | $264,000 | $265,700 |
| 2018 | $4,883 | $463,300 | $209,000 | $254,300 |
| 2017 | $4,577 | $426,200 | $187,000 | $239,200 |
| 2016 | $4,325 | $393,900 | $165,000 | $228,900 |
| 2015 | $4,193 | $378,800 | $158,400 | $220,400 |
| 2014 | $4,131 | $361,700 | $158,400 | $203,300 |
Source: Public Records
Map
Nearby Homes
- 1 Pantano St
- 106 Home Park Rd
- 48 Conrad St
- 74 Magnolia St
- 159 Hobart St
- 141 Hobart St
- 86 Alton Rd
- 10 Skyline Dr Unit 5
- 30 Skyline Dr Unit 6
- 312 Shaw St
- 9 Berwick St
- 9 Independence Ave Unit 307
- 25 W Howard St Unit D2
- 15 Bower Rd Unit B5
- 15 Bower Rd Unit B2
- 67 Somerville Ave
- 192 Federal Ave Unit B
- 125 Allen St Unit A
- 51 Faxon St
- 200 Falls Blvd Unit C308