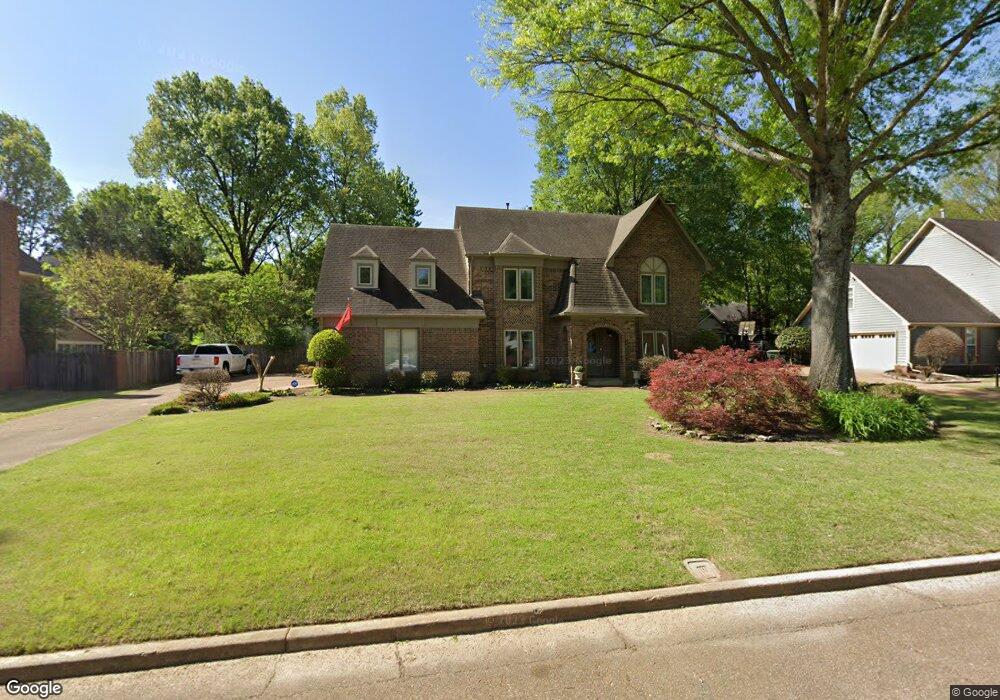
445 Quail Crest Dr Collierville, TN 38017
Estimated Value: $410,000 - $454,000
3
Beds
2
Baths
2,693
Sq Ft
$160/Sq Ft
Est. Value
About This Home
This home is located at 445 Quail Crest Dr, Collierville, TN 38017 and is currently estimated at $431,971, approximately $160 per square foot. 445 Quail Crest Dr is a home located in Shelby County with nearby schools including Collierville Elementary School, West Collierville Middle School, and Collierville High School.
Ownership History
Date
Name
Owned For
Owner Type
Purchase Details
Closed on
Oct 1, 2020
Sold by
Dugger Justin E and Dugger Jill Barron
Bought by
Dugger Justin Earl and Dugger Jill Barron
Current Estimated Value
Purchase Details
Closed on
Jan 15, 2004
Sold by
Freed William E and Freed Traci L
Bought by
Dugger Justin E and Dugger Jill Barron
Home Financials for this Owner
Home Financials are based on the most recent Mortgage that was taken out on this home.
Original Mortgage
$218,732
Outstanding Balance
$102,079
Interest Rate
5.87%
Mortgage Type
Unknown
Estimated Equity
$329,892
Purchase Details
Closed on
Jul 30, 1999
Sold by
Pittman Gurkin and Pittman Marla
Bought by
Freed William E and Freed Traci L
Home Financials for this Owner
Home Financials are based on the most recent Mortgage that was taken out on this home.
Original Mortgage
$162,350
Interest Rate
7.66%
Purchase Details
Closed on
Oct 18, 1995
Bought by
Maher Thomas J and Maher Bonita A
Create a Home Valuation Report for This Property
The Home Valuation Report is an in-depth analysis detailing your home's value as well as a comparison with similar homes in the area
Home Values in the Area
Average Home Value in this Area
Purchase History
| Date | Buyer | Sale Price | Title Company |
|---|---|---|---|
| Dugger Justin Earl | -- | None Available | |
| Dugger Justin E | $215,500 | Security Title Company Inc | |
| Freed William E | $170,900 | -- | |
| Maher Thomas J | $157,500 | -- |
Source: Public Records
Mortgage History
| Date | Status | Borrower | Loan Amount |
|---|---|---|---|
| Open | Dugger Justin E | $218,732 | |
| Previous Owner | Freed William E | $162,350 |
Source: Public Records
Tax History Compared to Growth
Tax History
| Year | Tax Paid | Tax Assessment Tax Assessment Total Assessment is a certain percentage of the fair market value that is determined by local assessors to be the total taxable value of land and additions on the property. | Land | Improvement |
|---|---|---|---|---|
| 2025 | $2,912 | $111,825 | $19,975 | $91,850 |
| 2024 | $2,912 | $85,900 | $12,825 | $73,075 |
| 2023 | $4,493 | $85,900 | $12,825 | $73,075 |
| 2022 | $4,389 | $85,900 | $12,825 | $73,075 |
| 2021 | $4,441 | $85,900 | $12,825 | $73,075 |
| 2020 | $3,813 | $64,850 | $12,825 | $52,025 |
| 2019 | $2,626 | $64,850 | $12,825 | $52,025 |
| 2018 | $2,626 | $64,850 | $12,825 | $52,025 |
| 2017 | $2,489 | $60,550 | $12,825 | $47,725 |
| 2016 | $2,444 | $55,925 | $0 | $0 |
| 2014 | $2,444 | $55,925 | $0 | $0 |
Source: Public Records
Map
Nearby Homes
- 607 Forestdale Dr
- 250 S Monterey Mills Cove
- 135 Piperton Preserve Park
- 40 Rambling Rex Dr
- 276 Morton Rd
- 475 Ginny Ln
- 542 Country Springs Dr
- 549 Peterson Lake Rd
- 230 W Powell Rd
- 895 Joe Dr
- 154 Bancroft Ave
- 910 Sugar Cove
- 212 Anita Cove
- 954 Wildbird Cove
- 759 W Powell Rd
- 1023 Greencliff Rd
- 110 Hillwood Ln
- 883 Mercersburg Cove
- 858 Gunnison Dr
- 541 Carruthers Rd
- 433 Quail Crest Dr
- 454 King Ridge Dr
- 442 King Ridge Dr
- 463 Quail Crest Dr
- 446 Quail Crest Dr
- 423 Quail Crest Dr
- 466 King Ridge Dr
- 434 Quail Crest Dr
- 454 Quail Crest Dr
- 432 King Ridge Dr
- 424 Quail Crest Dr
- 464 Quail Crest Dr
- 473 Quail Crest Dr
- 415 Quail Crest Dr
- 476 King Ridge Dr
- 420 King Ridge Dr
- 441 Royal Elm Dr
- 451 Royal Elm Dr
- 453 King Ridge Dr
- 431 Royal Elm Dr