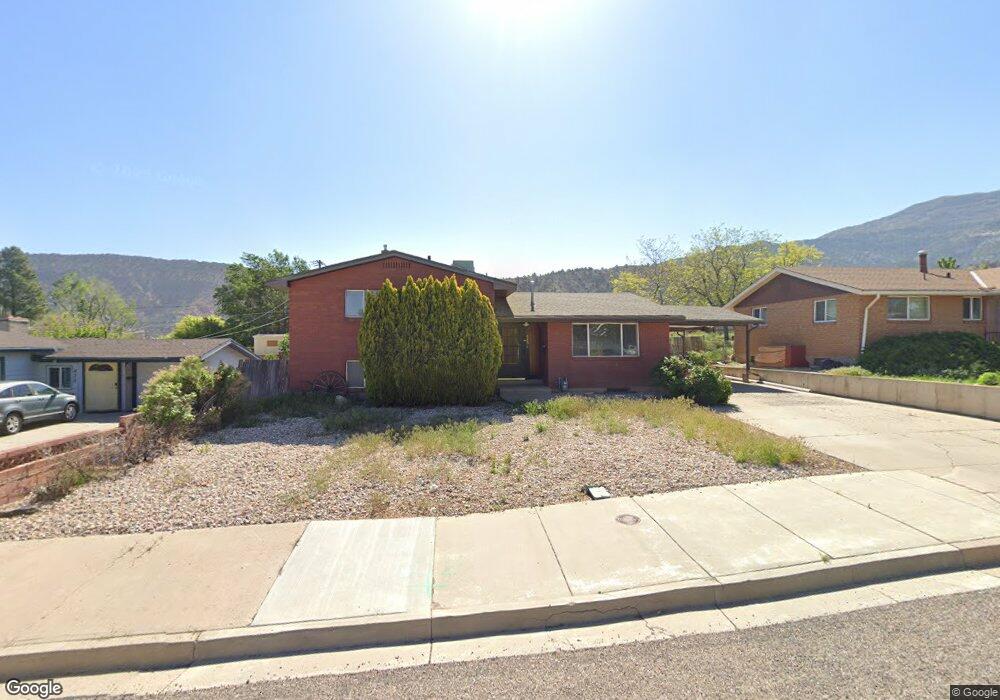
445 S 225 E Cedar City, UT 84720
Estimated Value: $370,000 - $390,026
Studio
--
Bath
1,900
Sq Ft
$201/Sq Ft
Est. Value
About This Home
This home is located at 445 S 225 E, Cedar City, UT 84720 and is currently estimated at $381,507, approximately $200 per square foot. 445 S 225 E is a home with nearby schools including Cedar East School, Cedar Middle School, and Cedar City High School.
Ownership History
Date
Name
Owned For
Owner Type
Purchase Details
Closed on
Nov 6, 2024
Sold by
Louie Tong Revocable Trust and Slack Louise
Bought by
Martinez Junice Acosta
Current Estimated Value
Home Financials for this Owner
Home Financials are based on the most recent Mortgage that was taken out on this home.
Original Mortgage
$237,500
Outstanding Balance
$234,873
Interest Rate
6.08%
Mortgage Type
New Conventional
Estimated Equity
$146,634
Purchase Details
Closed on
Sep 4, 2024
Sold by
Tong Louie
Bought by
Louie Tong Revocable Trust and Slack
Create a Home Valuation Report for This Property
The Home Valuation Report is an in-depth analysis detailing your home's value as well as a comparison with similar homes in the area
Home Values in the Area
Average Home Value in this Area
Purchase History
| Date | Buyer | Sale Price | Title Company |
|---|---|---|---|
| Martinez Junice Acosta | -- | Cedar Land Title | |
| Louie Tong Revocable Trust | -- | None Listed On Document |
Source: Public Records
Mortgage History
| Date | Status | Borrower | Loan Amount |
|---|---|---|---|
| Open | Martinez Junice Acosta | $237,500 |
Source: Public Records
Tax History
| Year | Tax Paid | Tax Assessment Tax Assessment Total Assessment is a certain percentage of the fair market value that is determined by local assessors to be the total taxable value of land and additions on the property. | Land | Improvement |
|---|---|---|---|---|
| 2025 | $1,787 | $229,758 | $39,404 | $190,354 |
| 2023 | $1,794 | $189,350 | $39,405 | $149,945 |
| 2022 | $1,511 | $164,355 | $39,400 | $124,955 |
| 2021 | $1,321 | $143,735 | $18,765 | $124,970 |
| 2020 | $1,265 | $122,050 | $18,765 | $103,285 |
| 2019 | $1,099 | $101,380 | $18,765 | $82,615 |
| 2018 | $1,136 | $101,380 | $18,765 | $82,615 |
| 2017 | $954 | $83,805 | $16,790 | $67,015 |
| 2016 | $1,014 | $83,000 | $15,985 | $67,015 |
| 2015 | $950 | $73,735 | $0 | $0 |
| 2014 | $907 | $65,785 | $0 | $0 |
Source: Public Records
Map
Nearby Homes
- 102 E 400 S
- 314 S 200 E
- 334 S 400 E Unit 2
- 642 S Sunset Dr
- 680 S 75 E
- 189 S 400 E
- 0 Hwy 14 Unit 23-243193
- 131 S 200 E
- 9 E 820 S
- 95 S 200 E
- 857 S 25 E
- 42 S 400 E
- 922 S 25 W
- 920 S 25 E Unit 17 G
- 920 S 25 E Unit 10C
- 920 S 25 E Unit 9H
- 920 S 25 E Unit 7C
- 357 Joe Thurston Way Unit 10
- 357 Joe Thurston Way Unit s 10-19
- 358 Joe Thurston Way Unit s 1-9
Your Personal Tour Guide
Ask me questions while you tour the home.