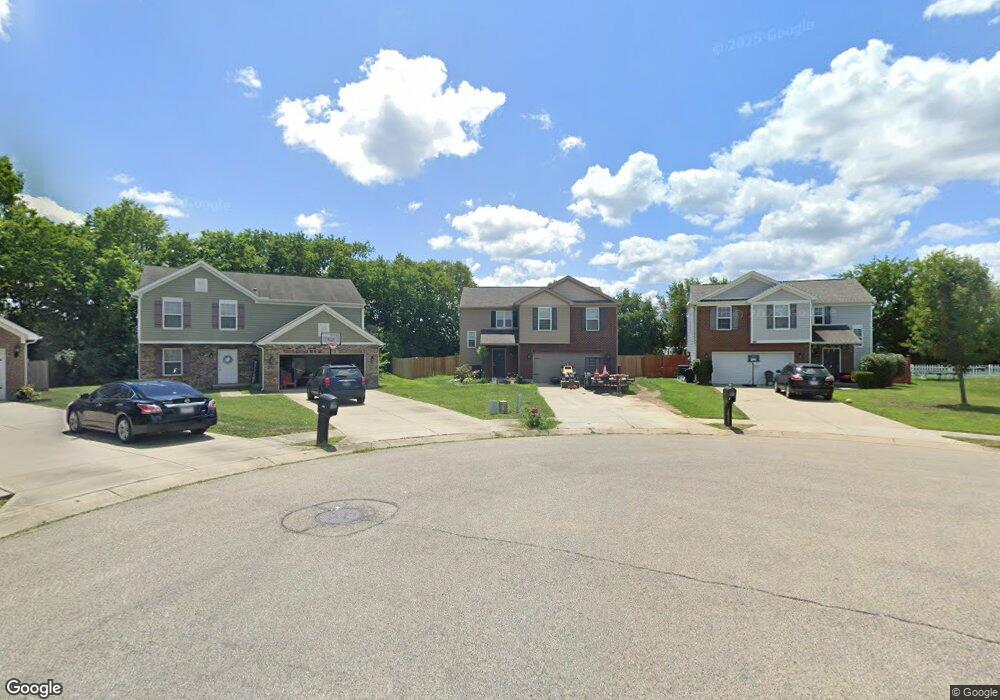
445 Sharp Ct Trenton, OH 45067
Estimated Value: $268,320 - $307,000
3
Beds
3
Baths
1,679
Sq Ft
$169/Sq Ft
Est. Value
About This Home
This home is located at 445 Sharp Ct, Trenton, OH 45067 and is currently estimated at $284,080, approximately $169 per square foot. 445 Sharp Ct is a home with nearby schools including Edgewood Intermediate School and Edgewood High School.
Ownership History
Date
Name
Owned For
Owner Type
Purchase Details
Closed on
Dec 19, 2016
Sold by
Cristo Homes Inc
Bought by
Jackson Brittany L
Current Estimated Value
Home Financials for this Owner
Home Financials are based on the most recent Mortgage that was taken out on this home.
Original Mortgage
$151,272
Outstanding Balance
$121,371
Interest Rate
3.57%
Mortgage Type
New Conventional
Estimated Equity
$162,709
Purchase Details
Closed on
Jul 7, 2016
Sold by
Ja Development Llc
Bought by
J A Development Llc
Home Financials for this Owner
Home Financials are based on the most recent Mortgage that was taken out on this home.
Interest Rate
3.41%
Create a Home Valuation Report for This Property
The Home Valuation Report is an in-depth analysis detailing your home's value as well as a comparison with similar homes in the area
Home Values in the Area
Average Home Value in this Area
Purchase History
| Date | Buyer | Sale Price | Title Company |
|---|---|---|---|
| Jackson Brittany L | $149,760 | None Available | |
| J A Development Llc | $7,500 | -- |
Source: Public Records
Mortgage History
| Date | Status | Borrower | Loan Amount |
|---|---|---|---|
| Open | Jackson Brittany L | $151,272 | |
| Previous Owner | J A Development Llc | -- |
Source: Public Records
Tax History
| Year | Tax Paid | Tax Assessment Tax Assessment Total Assessment is a certain percentage of the fair market value that is determined by local assessors to be the total taxable value of land and additions on the property. | Land | Improvement |
|---|---|---|---|---|
| 2025 | $3,065 | $72,840 | $7,610 | $65,230 |
| 2024 | $3,065 | $72,840 | $7,610 | $65,230 |
| 2023 | $3,051 | $73,380 | $7,610 | $65,770 |
| 2022 | $2,398 | $51,350 | $7,610 | $43,740 |
| 2021 | $2,432 | $51,350 | $7,610 | $43,740 |
| 2020 | $2,509 | $51,350 | $7,610 | $43,740 |
| 2019 | $2,732 | $47,610 | $7,650 | $39,960 |
| 2018 | $2,470 | $47,610 | $7,650 | $39,960 |
| 2017 | $2,472 | $47,610 | $7,650 | $39,960 |
| 2016 | $79 | $1,410 | $1,410 | $0 |
| 2015 | $67 | $1,410 | $1,410 | $0 |
| 2014 | $72 | $1,410 | $1,410 | $0 |
| 2013 | $72 | $1,410 | $1,410 | $0 |
Source: Public Records
Map
Nearby Homes
- 300 Sal Blvd
- 435 E State St
- 487 Peyton Dr
- 106 Trenton Place
- 204 Ohio Ave
- 202 Ohio Ave
- 307 Trenton Place
- 117 Ohio Ave
- 610 Princeton Dr
- 237 Linda Ct
- 417 Kerry St
- 410 Waterstone Ct
- 200 Greenwood Ln
- 404 Sudbury Dr
- 425 Clara Dr
- 109 Cranewood Dr
- 319 Newbury Place
- 423 Cranewood Dr
- 704 Terrace Ct
- 114 Day Place
Your Personal Tour Guide
Ask me questions while you tour the home.