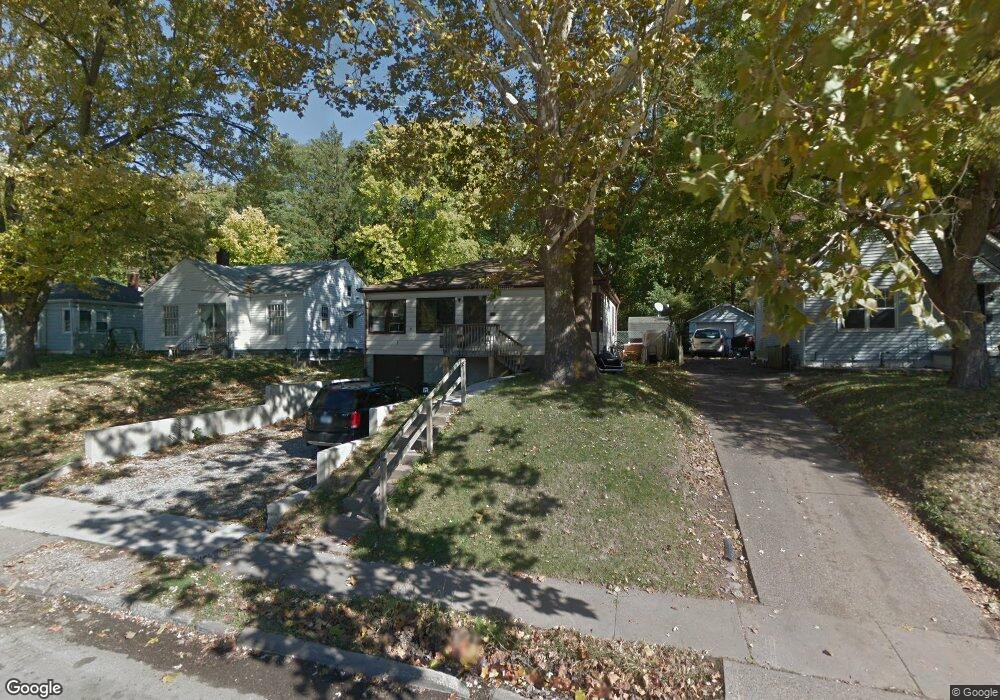
445 Waverly Rd Davenport, IA 52804
West End NeighborhoodEstimated Value: $93,000 - $124,000
2
Beds
1
Bath
980
Sq Ft
$114/Sq Ft
Est. Value
About This Home
This home is located at 445 Waverly Rd, Davenport, IA 52804 and is currently estimated at $111,667, approximately $113 per square foot. 445 Waverly Rd is a home located in Scott County with nearby schools including Walnut Hill Elementary School, South Christian Elementary School, and Wilson Elementary School.
Ownership History
Date
Name
Owned For
Owner Type
Purchase Details
Closed on
Aug 19, 2010
Sold by
Souhrada Darrell and Souhrada Donna E
Bought by
Spca Llc
Current Estimated Value
Home Financials for this Owner
Home Financials are based on the most recent Mortgage that was taken out on this home.
Original Mortgage
$55,350
Outstanding Balance
$36,666
Interest Rate
4.58%
Mortgage Type
Future Advance Clause Open End Mortgage
Estimated Equity
$75,001
Purchase Details
Closed on
Mar 15, 2010
Sold by
The Secretary Of Housing & Urban Develop
Bought by
Souhrada Darrell
Purchase Details
Closed on
Sep 28, 2007
Sold by
Antle Roger D and Antle Pamela D
Bought by
Antle Cory D
Home Financials for this Owner
Home Financials are based on the most recent Mortgage that was taken out on this home.
Original Mortgage
$67,132
Interest Rate
6.66%
Mortgage Type
FHA
Create a Home Valuation Report for This Property
The Home Valuation Report is an in-depth analysis detailing your home's value as well as a comparison with similar homes in the area
Home Values in the Area
Average Home Value in this Area
Purchase History
| Date | Buyer | Sale Price | Title Company |
|---|---|---|---|
| Spca Llc | $37,500 | None Available | |
| Souhrada Darrell | -- | None Available | |
| Antle Cory D | $80,000 | None Available |
Source: Public Records
Mortgage History
| Date | Status | Borrower | Loan Amount |
|---|---|---|---|
| Open | Spca Llc | $55,350 | |
| Previous Owner | Antle Cory D | $67,132 |
Source: Public Records
Tax History Compared to Growth
Tax History
| Year | Tax Paid | Tax Assessment Tax Assessment Total Assessment is a certain percentage of the fair market value that is determined by local assessors to be the total taxable value of land and additions on the property. | Land | Improvement |
|---|---|---|---|---|
| 2025 | $1,790 | $111,550 | $20,800 | $90,750 |
| 2024 | $1,752 | $100,200 | $20,800 | $79,400 |
| 2023 | $1,908 | $100,480 | $16,900 | $83,580 |
| 2022 | $1,918 | $89,370 | $16,900 | $72,470 |
| 2021 | $1,918 | $89,370 | $16,900 | $72,470 |
| 2020 | $1,810 | $83,280 | $16,900 | $66,380 |
| 2019 | $2,056 | $77,850 | $16,900 | $60,950 |
| 2018 | $250 | $77,850 | $16,900 | $60,950 |
| 2017 | $1,694 | $74,470 | $16,900 | $57,570 |
| 2016 | $1,624 | $74,170 | $0 | $0 |
| 2015 | $1,624 | $75,340 | $0 | $0 |
| 2014 | $1,674 | $75,340 | $0 | $0 |
| 2013 | $1,644 | $0 | $0 | $0 |
| 2012 | -- | $71,240 | $17,020 | $54,220 |
Source: Public Records
Map
Nearby Homes
- 511 Waverly Rd
- 2243 W 4th St
- 926 Cimarron Dr
- 2101 W 5th St
- 2312 1/2 W 1st St
- 2114 Telegraph Rd
- 2312 W 1st St
- 2024 W 6th St
- 2633 Farragut Place
- 120 N Pine St
- 3117 Schuetzen Ln
- 131 S Lincoln Ave
- 129 S Birchwood Ave
- 1107 N Thornwood Ave
- 321 Cedar St
- 1119 N Thornwood Ave
- 223 S Lincoln Ave
- 2011 W 2nd St
- 211 Cedar St
- 1203 N Thornwood Ave
- 439 Waverly Rd
- 503 Waverly Rd
- 431 Waverly Rd
- 517 Waverly Rd
- 425 Waverly Rd
- 448 Waverly Rd
- 444 Waverly Rd
- 504 Waverly Rd
- 438 Waverly Rd
- 523 Waverly Rd
- 510 Waverly Rd
- 432 Waverly Rd
- 417 Waverly Rd
- 426 Waverly Rd
- 518 Waverly Rd
- 527 Waverly Rd
- 422 Waverly Rd
- 524 Waverly Rd
- 2320 Telegraph Rd
- 418 Waverly Rd