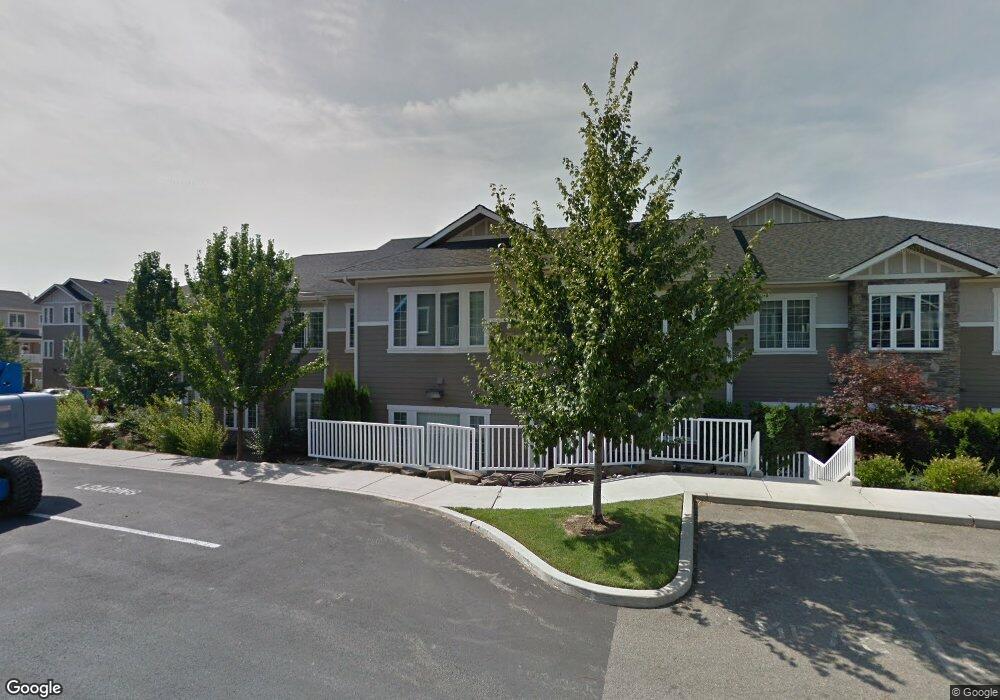
4450 Greenchain Loop Unit 3 Coeur D'Alene, ID 83814
Spokane River District NeighborhoodEstimated Value: $473,328 - $554,000
3
Beds
3
Baths
1,685
Sq Ft
$313/Sq Ft
Est. Value
About This Home
This home is located at 4450 Greenchain Loop Unit 3, Coeur D'Alene, ID 83814 and is currently estimated at $526,832, approximately $312 per square foot. 4450 Greenchain Loop Unit 3 is a home located in Kootenai County with nearby schools including Winton Elementary School, Lakes Magnet Middle School, and Lake City High School.
Ownership History
Date
Name
Owned For
Owner Type
Purchase Details
Closed on
Jan 31, 2024
Sold by
Blas Scott and Blas Deena
Bought by
Poling Todd G and Poling Rosamaria Desimone
Current Estimated Value
Purchase Details
Closed on
Jan 30, 2024
Sold by
Poling Todd G and Desimone Rosamaria
Bought by
Poling-Desimone Living Trust and Poling
Purchase Details
Closed on
Feb 8, 2014
Sold by
Federal Home Loan Mortgage Corporation
Bought by
Sicilia Franklin G and Sicilia Shannon B
Home Financials for this Owner
Home Financials are based on the most recent Mortgage that was taken out on this home.
Original Mortgage
$113,000
Interest Rate
4.34%
Mortgage Type
New Conventional
Purchase Details
Closed on
Aug 25, 2006
Sold by
Mill River Investments Llc
Bought by
Mallett Victoria and Mallett Gordon
Home Financials for this Owner
Home Financials are based on the most recent Mortgage that was taken out on this home.
Original Mortgage
$45,731
Interest Rate
6.67%
Mortgage Type
Stand Alone Second
Create a Home Valuation Report for This Property
The Home Valuation Report is an in-depth analysis detailing your home's value as well as a comparison with similar homes in the area
Home Values in the Area
Average Home Value in this Area
Purchase History
| Date | Buyer | Sale Price | Title Company |
|---|---|---|---|
| Poling Todd G | -- | Titleone | |
| Poling-Desimone Living Trust | -- | Titleone | |
| Sicilia Franklin G | -- | Alliance Title | |
| Mallett Victoria | -- | -- |
Source: Public Records
Mortgage History
| Date | Status | Borrower | Loan Amount |
|---|---|---|---|
| Previous Owner | Sicilia Franklin G | $113,000 | |
| Previous Owner | Mallett Victoria | $45,731 |
Source: Public Records
Tax History Compared to Growth
Tax History
| Year | Tax Paid | Tax Assessment Tax Assessment Total Assessment is a certain percentage of the fair market value that is determined by local assessors to be the total taxable value of land and additions on the property. | Land | Improvement |
|---|---|---|---|---|
| 2025 | $1,551 | $435,818 | $1,000 | $434,818 |
| 2024 | $1,742 | $457,318 | $1,000 | $456,318 |
| 2023 | $1,742 | $553,182 | $1,000 | $552,182 |
| 2022 | $2,256 | $553,182 | $1,000 | $552,182 |
| 2021 | $2,027 | $359,051 | $1,000 | $358,051 |
| 2020 | $1,997 | $325,365 | $1,000 | $324,365 |
| 2019 | $2,202 | $304,936 | $1,000 | $303,936 |
| 2018 | $1,832 | $250,980 | $1,000 | $249,980 |
| 2017 | $1,663 | $225,158 | $1,000 | $224,158 |
| 2016 | $2,011 | $239,957 | $1,000 | $238,957 |
| 2015 | $2,356 | $255,940 | $1,000 | $254,940 |
| 2013 | $3,149 | $205,561 | $1,000 | $204,561 |
Source: Public Records
Map
Nearby Homes
- 4539 Greenchain Loop Unit 5
- 4467 Greenchain Loop Unit 1
- 4580 Greenchain Loop Unit 1
- 4444 Greenchain Loop Unit 3
- 4583 Greenchain Loop Unit 6
- 4445 Greenchain Loop Unit 2
- 4708 Kona
- 4752 Kona
- 4745 W Kona Dr
- 4083 W Shoreview Ln
- Ash Plan at Grand Mill
- Onyx Plan at Grand Mill
- 3276 N Grandmill Ln Unit 101
- 3276 N Grandmill Ln Unit 103
- 3226 N Grandmill Ln Unit 103
- 3222 N Grandmill Ln Unit 103
- 3222 N Grandmill Ln Unit 101
- 3222 N Grandmill Ln Unit 102
- 3990 W Shoreview Ln
- 3922 W Shoreview Ln
- 4450 Greenchain Loop Unit 1
- 4450 Greenchain Loop Unit 4
- 4450 Greenchain Loop Unit 6
- 4450 Greenchain Loop Unit 8
- 4450 Greenchain Loop Unit 9
- 4450 Greenchain Loop Unit 7
- 4450 Greenchain Loop Unit 2
- 4450 W Greenchain Lp #8
- 4450 W Greenchain Loop #6
- 4471 Greenchain Loop Unit 3
- 4471 Greenchain Loop Unit 5
- 4576 Greenchain Loop Unit 4
- 4576 Greenchain Loop Unit 5
- 4576 Greenchain Loop Unit 1
- 4576 Greenchain Loop Unit 6
- 4576 Greenchain Loop Unit 7
- 4576 Greenchain Loop Unit 3
- 4471 Greenchain Loop Unit 2
- 4471 Greenchain Loop Unit 1
- 4576 Greenchain Loop Unit 8