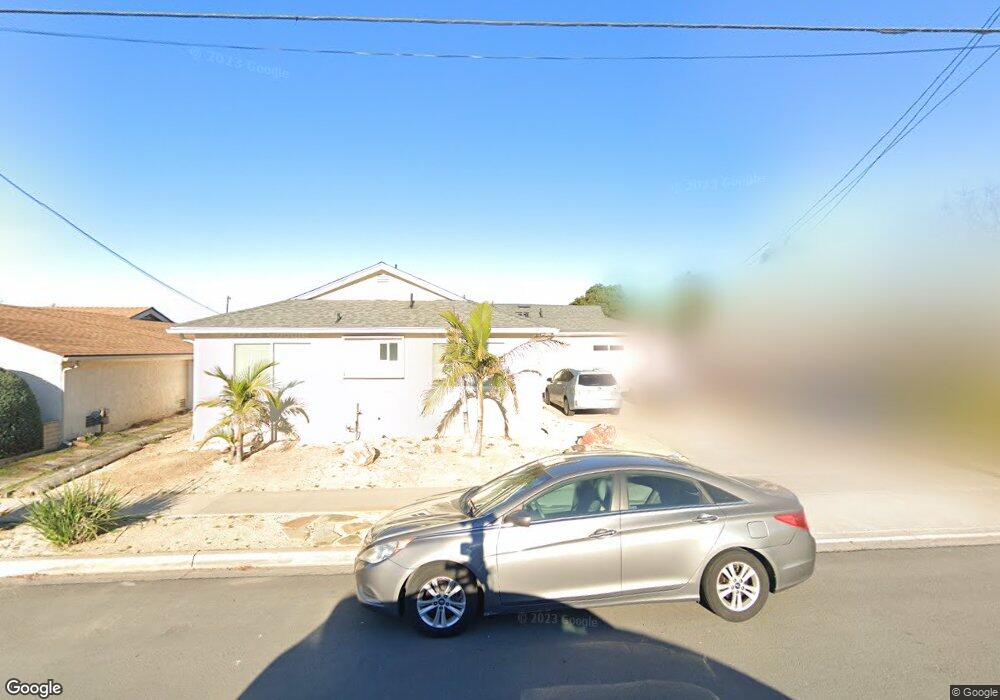
4450 Mount Henry Ave San Diego, CA 92117
Clairemont Mesa West NeighborhoodEstimated Value: $1,120,670 - $1,270,000
4
Beds
2
Baths
1,176
Sq Ft
$1,011/Sq Ft
Est. Value
About This Home
This home is located at 4450 Mount Henry Ave, San Diego, CA 92117 and is currently estimated at $1,188,918, approximately $1,010 per square foot. 4450 Mount Henry Ave is a home located in San Diego County with nearby schools including Holmes Elementary, Marston Middle School, and Clairemont High School.
Ownership History
Date
Name
Owned For
Owner Type
Purchase Details
Closed on
Dec 6, 2019
Sold by
Harrison Rachel M
Bought by
Harrison Layne E
Current Estimated Value
Home Financials for this Owner
Home Financials are based on the most recent Mortgage that was taken out on this home.
Original Mortgage
$480,000
Outstanding Balance
$326,977
Interest Rate
3.75%
Estimated Equity
$861,941
Purchase Details
Closed on
Aug 17, 2019
Sold by
Harrison Layne E
Bought by
Harrison Layne E and Harrison Rachel M
Purchase Details
Closed on
Sep 29, 2014
Sold by
Harrison Layne
Bought by
Harrison Family Revocable Trust and Harrison Rachel M
Purchase Details
Closed on
Feb 24, 2014
Sold by
Kokun Michael W
Bought by
Harrison Layne and Gonzales Marilyn
Purchase Details
Closed on
Feb 21, 2014
Sold by
Gonzales Robert Joel
Bought by
Gonzales Marilyn
Purchase Details
Closed on
Jul 23, 1996
Sold by
Adelheid Kokun
Bought by
Kokun Adelheid B
Create a Home Valuation Report for This Property
The Home Valuation Report is an in-depth analysis detailing your home's value as well as a comparison with similar homes in the area
Home Values in the Area
Average Home Value in this Area
Purchase History
| Date | Buyer | Sale Price | Title Company |
|---|---|---|---|
| Harrison Layne E | -- | Wfg Title Co Of Ca San Diego | |
| Harrison Layne E | -- | None Available | |
| Harrison Layne E | -- | None Available | |
| Harrison Family Revocable Trust | -- | None Available | |
| Harrison Layne | $415,000 | Chicago Title Company | |
| Gonzales Marilyn | -- | Chicago Title Company | |
| Harrison Layne | -- | Chicago Title Company | |
| Kokun Adelheid B | -- | -- |
Source: Public Records
Mortgage History
| Date | Status | Borrower | Loan Amount |
|---|---|---|---|
| Open | Harrison Layne E | $480,000 |
Source: Public Records
Tax History Compared to Growth
Tax History
| Year | Tax Paid | Tax Assessment Tax Assessment Total Assessment is a certain percentage of the fair market value that is determined by local assessors to be the total taxable value of land and additions on the property. | Land | Improvement |
|---|---|---|---|---|
| 2025 | $7,014 | $578,716 | $441,789 | $136,927 |
| 2024 | $7,014 | $567,370 | $433,127 | $134,243 |
| 2023 | $6,857 | $556,246 | $424,635 | $131,611 |
| 2022 | $6,675 | $545,340 | $416,309 | $129,031 |
| 2021 | $6,621 | $534,648 | $408,147 | $126,501 |
| 2020 | $5,754 | $465,166 | $403,962 | $61,204 |
| 2019 | $5,651 | $456,046 | $396,042 | $60,004 |
| 2018 | $5,284 | $447,105 | $388,277 | $58,828 |
| 2017 | $5,159 | $438,339 | $380,664 | $57,675 |
| 2016 | $5,076 | $429,745 | $373,200 | $56,545 |
| 2015 | $5,001 | $423,291 | $367,595 | $55,696 |
| 2014 | $4,531 | $381,725 | $331,498 | $50,227 |
Source: Public Records
Map
Nearby Homes
- 4472 Mount Lindsey Ave
- 4772 Mount Gaywas Dr
- 4527 Chinook Ct
- 4380 Rolfe Rd
- 4915 Mount Gaywas Dr
- 4226 Mount Voss Dr
- 4666 Shoshoni Ave
- 4587 Rolfe Rd
- 4203 Tolowa St
- 4182 Seri St
- 4774 Chickasaw Ct
- 4781 Boise Ave
- 4501 Bannock Ave
- 4667 Chateau Place
- 4813 Boise Ave
- 4509 Manitou Way
- 4951 57 Genesee Ave
- 4576 Onondaga Ave
- 4716 Mount Cervin Dr
- 5061 Canosa Ave
- 4456 Mount Henry Ave
- 4444 Mount Henry Ave
- 4417 Mount Lindsey Ave
- 4423 Mount Lindsey Ave
- 4411 Mount Lindsey Ave
- 4462 Mount Henry Ave
- 4438 Mount Henry Ave
- 4429 Mount Lindsey Ave
- 4405 Mount Lindsey Ave
- 4451 Mount Henry Ave
- 4457 Mount Henry Ave
- 4445 Mount Henry Ave
- 4468 Mount Henry Ave
- 4463 Mount Henry Ave
- 4439 Mount Henry Ave
- 4435 Mount Lindsey Ave
- 4469 Mount Henry Ave
- 4474 Mount Henry Ave
- 4454 Mount Herbert Ave
- 4434 Mount Lindsey Ave