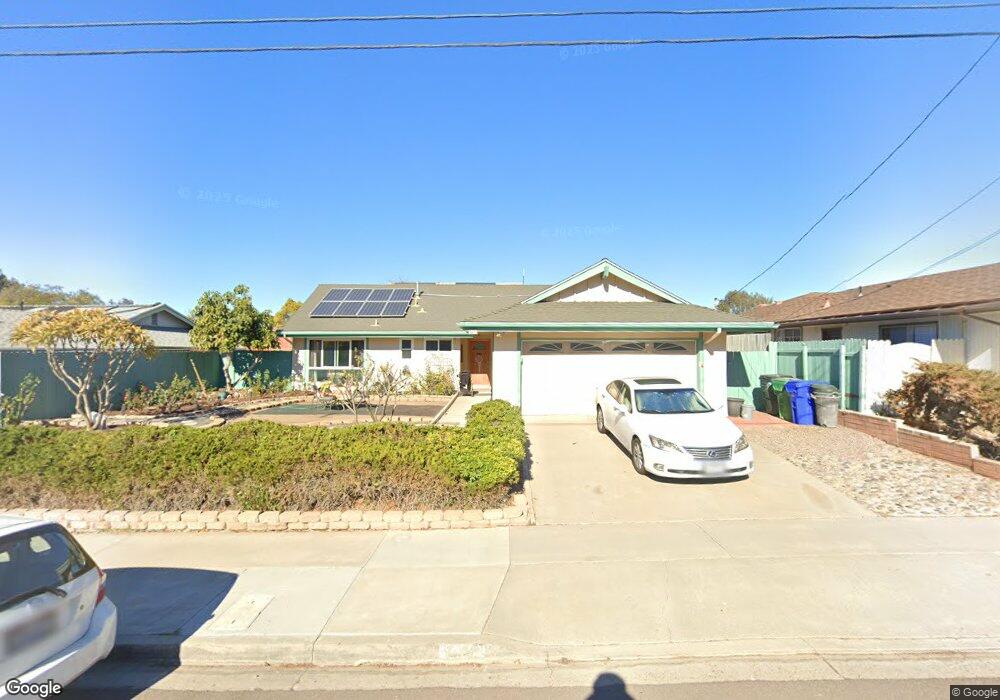
4450 Pavlov Ave San Diego, CA 92122
University City NeighborhoodEstimated Value: $1,213,000 - $1,572,000
3
Beds
2
Baths
1,334
Sq Ft
$1,042/Sq Ft
Est. Value
About This Home
This home is located at 4450 Pavlov Ave, San Diego, CA 92122 and is currently estimated at $1,390,315, approximately $1,042 per square foot. 4450 Pavlov Ave is a home located in San Diego County with nearby schools including Marie Curie Elementary School, Standley Middle School, and University City High School.
Ownership History
Date
Name
Owned For
Owner Type
Purchase Details
Closed on
Mar 30, 2018
Sold by
Baer Susan Lee
Bought by
Baer Susan Lee and Susan Lee Baer Trust
Current Estimated Value
Home Financials for this Owner
Home Financials are based on the most recent Mortgage that was taken out on this home.
Original Mortgage
$220,000
Outstanding Balance
$189,020
Interest Rate
4.4%
Mortgage Type
New Conventional
Estimated Equity
$1,201,295
Purchase Details
Closed on
Jun 15, 2017
Sold by
Baer Susan Lee and Pernia Susan Baer
Bought by
Baer Susan Lee
Purchase Details
Closed on
Oct 8, 1997
Sold by
Guiney Kathleen V Trust 08-30-88 and Kathleen V
Bought by
Pernia Susan Baer
Home Financials for this Owner
Home Financials are based on the most recent Mortgage that was taken out on this home.
Original Mortgage
$207,000
Interest Rate
7.36%
Create a Home Valuation Report for This Property
The Home Valuation Report is an in-depth analysis detailing your home's value as well as a comparison with similar homes in the area
Home Values in the Area
Average Home Value in this Area
Purchase History
| Date | Buyer | Sale Price | Title Company |
|---|---|---|---|
| Baer Susan Lee | -- | Accommodation | |
| Baer Susan Lee | -- | First American Title Sd | |
| Baer Susan Lee | -- | None Available | |
| Pernia Susan Baer | $230,000 | Old Republic Title Company |
Source: Public Records
Mortgage History
| Date | Status | Borrower | Loan Amount |
|---|---|---|---|
| Open | Baer Susan Lee | $220,000 | |
| Closed | Pernia Susan Baer | $207,000 |
Source: Public Records
Tax History Compared to Growth
Tax History
| Year | Tax Paid | Tax Assessment Tax Assessment Total Assessment is a certain percentage of the fair market value that is determined by local assessors to be the total taxable value of land and additions on the property. | Land | Improvement |
|---|---|---|---|---|
| 2025 | $4,371 | $367,231 | $223,534 | $143,697 |
| 2024 | $4,371 | $360,031 | $219,151 | $140,880 |
| 2023 | $4,272 | $352,972 | $214,854 | $138,118 |
| 2022 | $4,157 | $346,052 | $210,642 | $135,410 |
| 2021 | $4,127 | $339,267 | $206,512 | $132,755 |
| 2020 | $4,076 | $335,789 | $204,395 | $131,394 |
| 2019 | $4,002 | $329,206 | $200,388 | $128,818 |
| 2018 | $3,823 | $322,752 | $196,459 | $126,293 |
| 2017 | $81 | $316,424 | $192,607 | $123,817 |
| 2016 | $3,590 | $310,221 | $188,831 | $121,390 |
| 2015 | $3,536 | $305,562 | $185,995 | $119,567 |
| 2014 | $3,480 | $299,577 | $182,352 | $117,225 |
Source: Public Records
Map
Nearby Homes
- 5977 Erlanger St
- 4612 Benhurst Ave
- 6214 Agee St Unit 34
- 5889 Cozzens St
- 5962 Agee St
- 6188 Agee St Unit 230
- 4635 Pauling Ave
- 4282 Robbins St
- 6330 Genesee Ave Unit 220
- 6330 Genesee Ave Unit 112
- 6330 Genesee Ave Unit 213
- 4495 Cather Ave
- 7212 Florey St
- 5021 Via Cinta
- 4627 Huggins St
- 6547 Radcliffe Dr
- 3736 Millikin Ave
- 5448 Noah Way
- 3598 Syracuse Ave
- 7190 Shoreline Dr Unit 6313
- 4440 Pavlov Ave
- 4460 Pavlov Ave
- 4443 Governor Dr
- 4453 Governor Dr
- 4430 Pavlov Ave
- 4433 Governor Dr
- 4470 Pavlov Ave
- 4451 Pavlov Ave
- 4463 Governor Dr
- 4441 Pavlov Ave
- 4461 Pavlov Ave
- 4423 Governor Dr
- 4420 Pavlov Ave
- 4480 Pavlov Ave
- 4471 Pavlov Ave
- 4473 Governor Dr
- 4431 Pavlov Ave
- 4413 Governor Dr
- 4410 Pavlov Ave
- 4421 Pavlov Ave