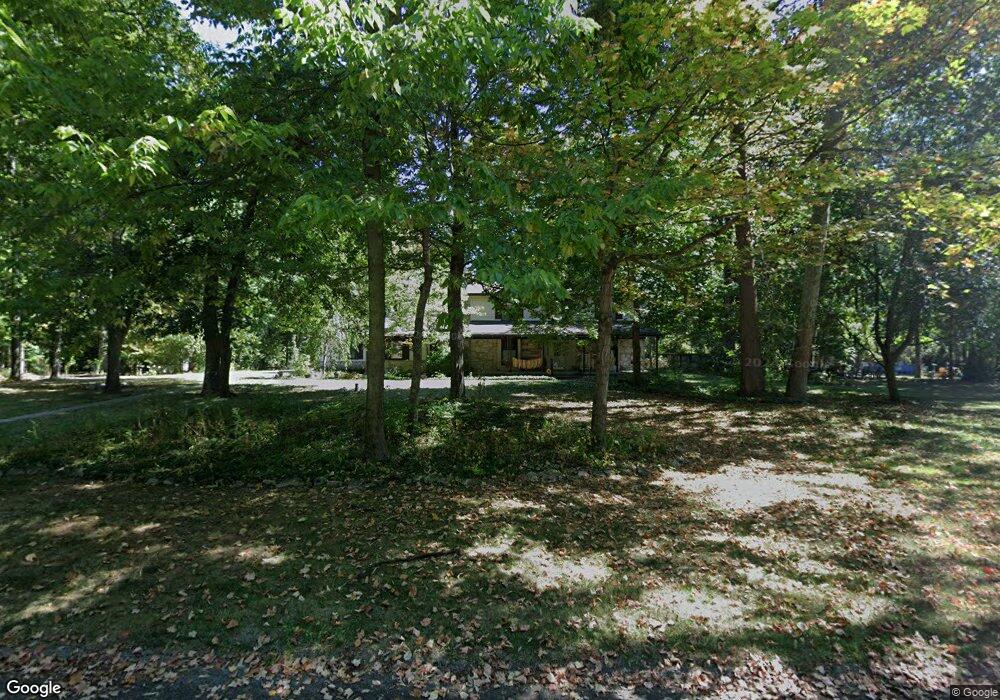
4451 Pinewood Ct Brownsburg, IN 46112
Estimated Value: $391,908 - $456,000
4
Beds
3
Baths
2,314
Sq Ft
$183/Sq Ft
Est. Value
About This Home
This home is located at 4451 Pinewood Ct, Brownsburg, IN 46112 and is currently estimated at $423,727, approximately $183 per square foot. 4451 Pinewood Ct is a home located in Hendricks County with nearby schools including Delaware Trail Elementary School, Brownsburg East Middle School, and Brownsburg High School.
Ownership History
Date
Name
Owned For
Owner Type
Purchase Details
Closed on
Nov 17, 2023
Sold by
Robert Allen Fulbright and Robert Michelle Rose
Bought by
Fulbright Samuel J
Current Estimated Value
Purchase Details
Closed on
Dec 16, 2014
Sold by
Fulbright Robert A and Fulbright Michelle R
Bought by
Fulbright Trust
Create a Home Valuation Report for This Property
The Home Valuation Report is an in-depth analysis detailing your home's value as well as a comparison with similar homes in the area
Home Values in the Area
Average Home Value in this Area
Purchase History
| Date | Buyer | Sale Price | Title Company |
|---|---|---|---|
| Fulbright Samuel J | -- | None Listed On Document | |
| Fulbright Trust | -- | -- |
Source: Public Records
Tax History
| Year | Tax Paid | Tax Assessment Tax Assessment Total Assessment is a certain percentage of the fair market value that is determined by local assessors to be the total taxable value of land and additions on the property. | Land | Improvement |
|---|---|---|---|---|
| 2025 | $3,257 | $339,300 | $45,500 | $293,800 |
| 2024 | $3,257 | $325,700 | $45,500 | $280,200 |
| 2023 | $3,103 | $310,300 | $43,200 | $267,100 |
| 2022 | $2,951 | $295,100 | $41,100 | $254,000 |
| 2021 | $2,688 | $268,800 | $41,100 | $227,700 |
| 2020 | $2,542 | $254,200 | $41,100 | $213,100 |
| 2019 | $2,194 | $219,400 | $37,800 | $181,600 |
| 2018 | $2,257 | $225,700 | $37,800 | $187,900 |
| 2017 | $2,155 | $215,500 | $36,000 | $179,500 |
| 2016 | $2,092 | $209,200 | $36,000 | $173,200 |
| 2014 | $1,968 | $196,800 | $35,000 | $161,800 |
| 2013 | $2,014 | $201,400 | $35,000 | $166,400 |
Source: Public Records
Map
Nearby Homes
- 6750 E County Road 425 N
- 154 Dover Blvd N
- 6433 Wings Ct
- 6415 Wings Ct
- 6338 Wings Ct
- 1432 Hideaway Cir
- 14 James Ct
- 6 Kristelli Ct
- 1314 Holiday Ln E
- 506 S Green St
- 4475 Yellowwood Ave
- 4472 Yellowwood Ave
- 4494 Yellowwood Ave
- 6274 Chelsea St
- 4498 Yellowwood Ave
- 4502 Yellowwood Ave
- 4481 Yellowwood Ave
- 7643 Sagamore Dr
- 4508 Yellowwood Ave
- 6284 Chelsea St
- 4423 Pinewood Ct
- 4487 Pinewood Ct
- 4452 Forest Dr
- 4418 Forest Dr
- 4484 Forest Dr
- 4391 Pinewood Ct
- 4474 Pinewood Ct
- 4402 Forest Dr
- 4480 Pinewood Ct
- 4404 Pinewood Ct
- 4430 Pinewood Ct
- 4439 Westside Dr
- 4367 Pinewood Ct
- 5544 Forest Dr
- 5612 Forest Dr
- 4475 Forest Dr
- 300 Northside Dr
- 4328 Forest Dr
- 4366 Pinewood Ct
- 4385 Forest Dr
Your Personal Tour Guide
Ask me questions while you tour the home.