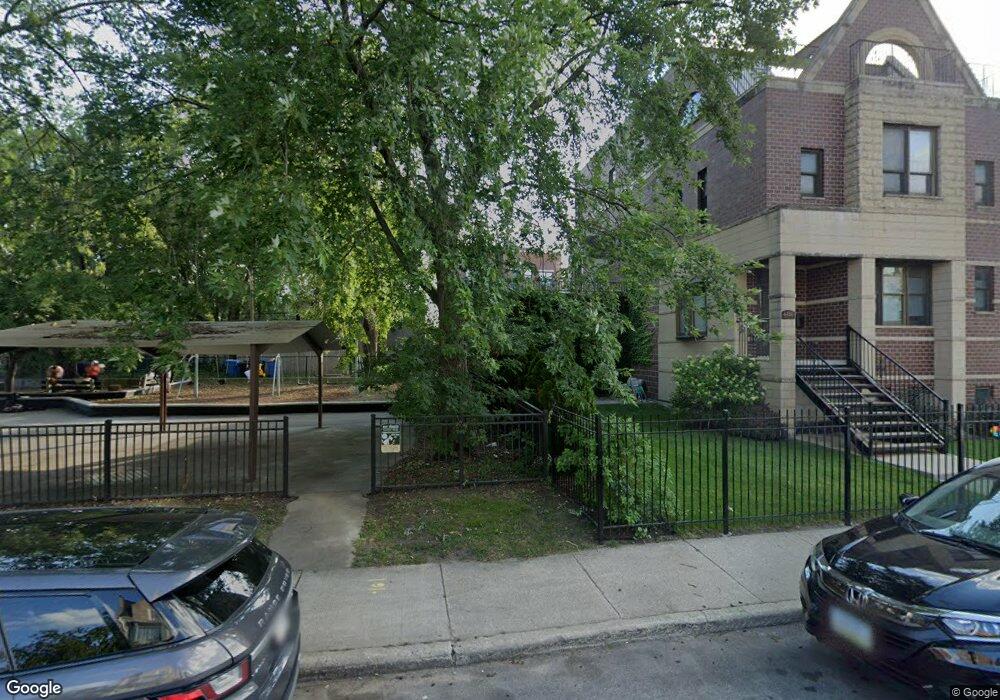
4452 S Oakenwald Ave Unit 1N Chicago, IL 60653
Kenwood NeighborhoodEstimated Value: $267,000 - $271,000
--
Bed
--
Bath
12,660
Sq Ft
$21/Sq Ft
Est. Value
About This Home
This home is located at 4452 S Oakenwald Ave Unit 1N, Chicago, IL 60653 and is currently estimated at $269,287, approximately $21 per square foot. 4452 S Oakenwald Ave Unit 1N is a home located in Cook County with nearby schools including Robinson Elementary School, Woodson South Elementary School, and The UChicago Charter School - North Kenwood/Oakland.
Ownership History
Date
Name
Owned For
Owner Type
Purchase Details
Closed on
Jun 17, 2025
Sold by
Harrington Darlene
Bought by
Kamara Natoshua L
Current Estimated Value
Home Financials for this Owner
Home Financials are based on the most recent Mortgage that was taken out on this home.
Original Mortgage
$269,637
Outstanding Balance
$268,987
Interest Rate
7.13%
Mortgage Type
New Conventional
Estimated Equity
$300
Purchase Details
Closed on
Nov 3, 2021
Sold by
Greene Michelle and Estate Of Darlene Harrington
Bought by
Greene Chrystal Joyce
Purchase Details
Closed on
Apr 29, 2002
Sold by
Ocwen Federal Bank Fsb
Bought by
Harrington Darlene
Home Financials for this Owner
Home Financials are based on the most recent Mortgage that was taken out on this home.
Original Mortgage
$130,000
Interest Rate
7.16%
Purchase Details
Closed on
Oct 3, 2001
Sold by
Page Lawrence D and Page Patricia
Bought by
Ocwen Financial Bank Fsb
Create a Home Valuation Report for This Property
The Home Valuation Report is an in-depth analysis detailing your home's value as well as a comparison with similar homes in the area
Home Values in the Area
Average Home Value in this Area
Purchase History
| Date | Buyer | Sale Price | Title Company |
|---|---|---|---|
| Kamara Natoshua L | $265,000 | None Listed On Document | |
| Greene Chrystal Joyce | -- | Attorney | |
| Harrington Darlene | $153,000 | First American Title | |
| Ocwen Financial Bank Fsb | -- | -- |
Source: Public Records
Mortgage History
| Date | Status | Borrower | Loan Amount |
|---|---|---|---|
| Open | Kamara Natoshua L | $269,637 | |
| Closed | Harrington Darlene | $130,000 |
Source: Public Records
Tax History Compared to Growth
Tax History
| Year | Tax Paid | Tax Assessment Tax Assessment Total Assessment is a certain percentage of the fair market value that is determined by local assessors to be the total taxable value of land and additions on the property. | Land | Improvement |
|---|---|---|---|---|
| 2024 | $4,235 | $32,148 | $3,878 | $28,270 |
| 2023 | $4,113 | $20,000 | $3,878 | $16,122 |
| 2022 | $4,113 | $20,000 | $3,878 | $16,122 |
| 2021 | $4,022 | $19,999 | $3,877 | $16,122 |
| 2020 | $1,078 | $10,422 | $1,883 | $8,539 |
| 2019 | $1,069 | $11,492 | $1,883 | $9,609 |
| 2018 | $913 | $11,492 | $1,883 | $9,609 |
| 2017 | $2,748 | $12,764 | $1,551 | $11,213 |
| 2016 | $2,556 | $12,764 | $1,551 | $11,213 |
| 2015 | $2,339 | $12,764 | $1,551 | $11,213 |
| 2014 | $3,588 | $19,340 | $1,329 | $18,011 |
| 2013 | $3,517 | $19,340 | $1,329 | $18,011 |
Source: Public Records
Map
Nearby Homes
- 4532 S Oakenwald Ave
- 4511 S Lake Park Ave Unit 3S
- 4453 S Lake Park Ave Unit 4
- 4457 S Oakenwald Ave
- 4518 S Woodlawn Ave Unit 4518
- 1221 E 46th St Unit 1
- 1150 E 46th St
- 4530 S Woodlawn Ave Unit 101
- 4364 S Oakenwald Ave
- 4350 S Oakenwald Ave Unit 3
- 4721 S Woodlawn Ave Unit E
- 4355 S Lake Park Ave Unit 2N
- 4635 S Greenwood Ave
- 4458 S Greenwood Ave Unit 1E
- 4453 S Berkeley Ave Unit 1
- 4351 S Greenwood Ave Unit 3N
- 4801 S Kimbark Ave
- 4456 S Berkeley Ave
- 4444 S Berkeley Ave
- 4808 S Dorchester Ave Unit 3N
- 4452 S Oakenwald Ave Unit 3S
- 4452 S Oakenwald Ave Unit 3N
- 4452 S Oakenwald Ave Unit 2S
- 4554 S Oakenwald Ave Unit 3S
- 4554 S Oakenwald Ave Unit 1S
- 4552 S Oakenwald Ave Unit 2N
- 4552 S Oakenwald Ave Unit 2
- 4552 S Oakenwald Ave Unit 3N
- 4550 S Oakenwald Ave
- 4560 S Oakenwald Ave
- 4564 S Oakenwald Ave
- 4568 S Oakenwald Ave
- 4540 S Oakenwald Ave
- 4540 S Oakenwald Ave
- 4570 S Oakenwald Ave
- 4538 S Oakenwald Ave Unit 2
- 4538 S Oakenwald Ave Unit 3
- 4563 S Lake Park Ave
- 4565 S Lake Park Ave
- 4549 S Lake Park Ave