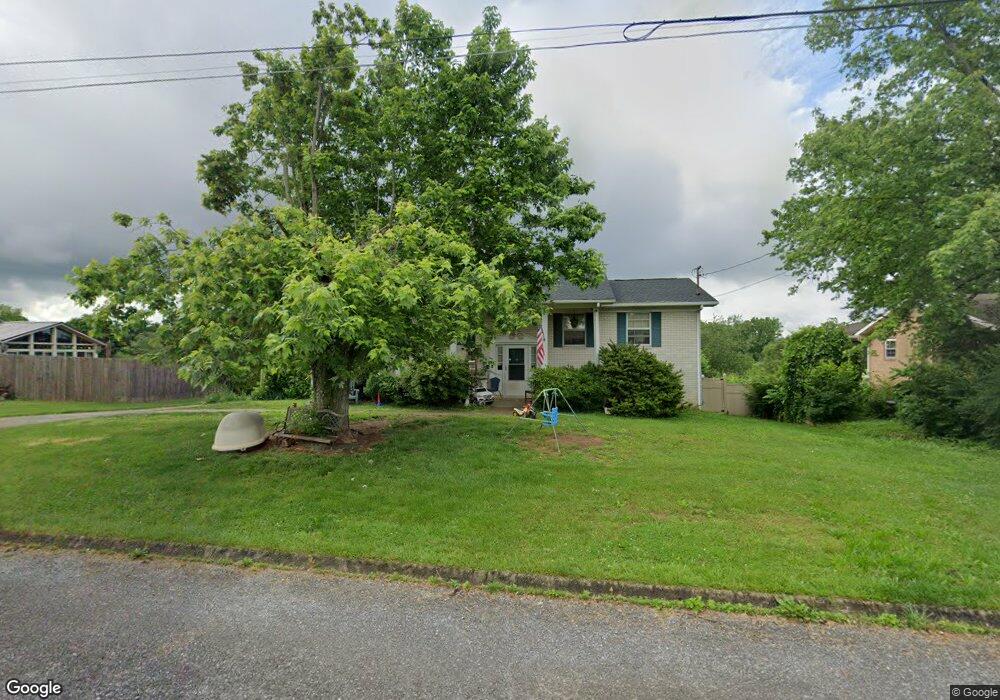
4454 Danbury Dr Morristown, TN 37813
Estimated Value: $245,099 - $317,000
--
Bed
2
Baths
1,350
Sq Ft
$209/Sq Ft
Est. Value
About This Home
This home is located at 4454 Danbury Dr, Morristown, TN 37813 and is currently estimated at $281,775, approximately $208 per square foot. 4454 Danbury Dr is a home located in Hamblen County with nearby schools including John Hay Elementary School, Meadowview Middle School, and Morristown East High School.
Ownership History
Date
Name
Owned For
Owner Type
Purchase Details
Closed on
May 17, 2004
Sold by
Dalton Larry C
Bought by
Ramsey William J
Current Estimated Value
Home Financials for this Owner
Home Financials are based on the most recent Mortgage that was taken out on this home.
Original Mortgage
$127,750
Outstanding Balance
$61,493
Interest Rate
5.88%
Mortgage Type
VA
Estimated Equity
$220,282
Purchase Details
Closed on
May 16, 2001
Sold by
Weems Ricky
Bought by
Dalton Larry
Home Financials for this Owner
Home Financials are based on the most recent Mortgage that was taken out on this home.
Original Mortgage
$76,000
Interest Rate
8%
Purchase Details
Closed on
Jan 2, 1991
Bought by
Weems Ricky L and Mary Ann
Purchase Details
Closed on
Apr 25, 1988
Purchase Details
Closed on
Jan 1, 1985
Bought by
Dugan Dain Walters and Dugan Jeanne
Create a Home Valuation Report for This Property
The Home Valuation Report is an in-depth analysis detailing your home's value as well as a comparison with similar homes in the area
Home Values in the Area
Average Home Value in this Area
Purchase History
| Date | Buyer | Sale Price | Title Company |
|---|---|---|---|
| Ramsey William J | $125,000 | -- | |
| Dalton Larry | $95,000 | -- | |
| Weems Ricky L | $65,300 | -- | |
| -- | $60,500 | -- | |
| Hermes Cleophus M | -- | -- | |
| Dugan Dain Walters | $55,500 | -- |
Source: Public Records
Mortgage History
| Date | Status | Borrower | Loan Amount |
|---|---|---|---|
| Open | Dugan Dain Walters | $127,750 | |
| Previous Owner | Dugan Dain Walters | $76,000 |
Source: Public Records
Tax History Compared to Growth
Tax History
| Year | Tax Paid | Tax Assessment Tax Assessment Total Assessment is a certain percentage of the fair market value that is determined by local assessors to be the total taxable value of land and additions on the property. | Land | Improvement |
|---|---|---|---|---|
| 2024 | $670 | $34,000 | $4,475 | $29,525 |
| 2023 | $670 | $34,000 | $0 | $0 |
| 2022 | $670 | $34,000 | $4,475 | $29,525 |
| 2021 | $670 | $34,000 | $4,475 | $29,525 |
| 2020 | $670 | $34,000 | $4,475 | $29,525 |
| 2019 | $640 | $30,050 | $4,125 | $25,925 |
| 2018 | $640 | $30,050 | $4,125 | $25,925 |
| 2017 | $640 | $30,050 | $4,125 | $25,925 |
| 2016 | $598 | $30,050 | $4,125 | $25,925 |
| 2015 | $556 | $30,050 | $4,125 | $25,925 |
| 2014 | -- | $30,050 | $4,125 | $25,925 |
| 2013 | -- | $34,550 | $0 | $0 |
Source: Public Records
Map
Nearby Homes
- 4458 Brockland Dr
- 4581 Lockley Ct
- 4705 E Hampton Blvd
- 670 Jones Franklin Rd
- 4510 Westover Place
- 4270 Brockland Dr
- 1148 George Byrd Rd
- 358 Dover Rd
- 288 Fuller Estate Cir
- 1342 Slop Creek Rd
- 4907 Barton Springs Dr
- 1689 Carroll Rd
- 1496 Dover Rd
- 00 Shinbone E Sugar Hollow Rd
- 3661 Halifax Cir
- 4271 Stansberry Rd
- 1744 Carroll Rd
- 4027 White Wood Cir
- 4091 White Wood Cir
- Tract 3 Shinbone Rd
- 4448 Danbury Dr
- 4456 Danbury Dr
- 4451 Ashford Dr
- 4431 Ashford Dr
- 4471 Ashford Dr
- 4453 Danbury Dr
- 4444 Danbury Dr
- 4449 Danbury Dr
- 4421 Ashford Dr
- 4464 Danbury Dr
- 4443 Danbury Dr
- 4487 Ashford Dr
- 4438 Danbury Dr
- 4452 Ashford Dr
- 4391 Ashford Dr
- 4439 Danbury Dr
- 4477 Danbury Dr
- 4476 Danbury Dr
- 4428 Danbury Dr
- 4490 Ashford Dr