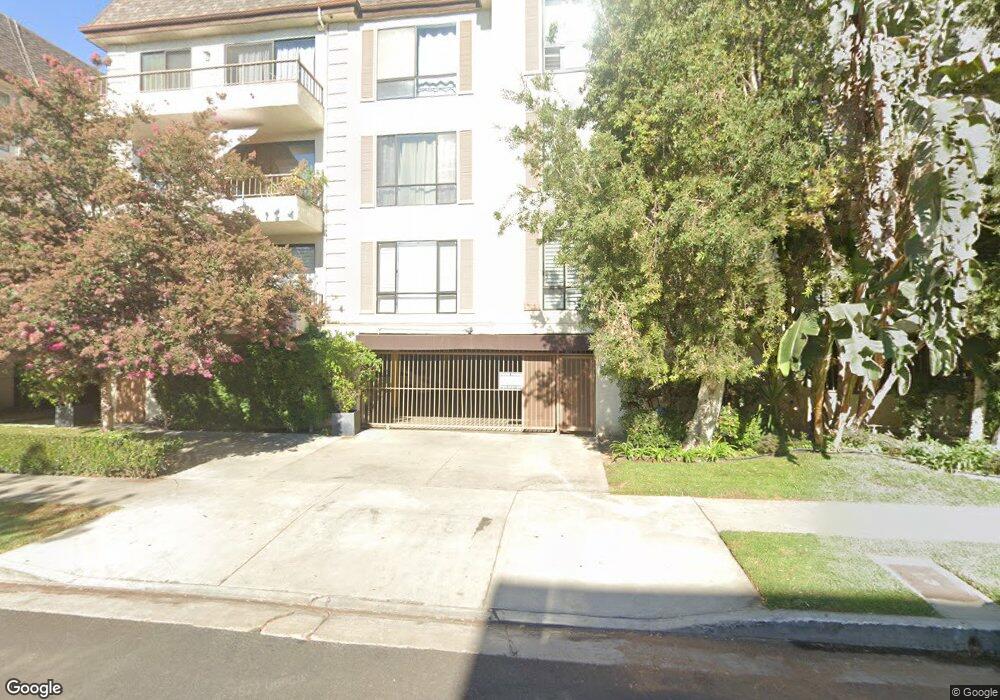
4454 Vntra Cyn Ave Unit 306 Sherman Oaks, CA 91423
Estimated Value: $737,473 - $998,000
1
Bed
2
Baths
1,837
Sq Ft
$447/Sq Ft
Est. Value
About This Home
This home is located at 4454 Vntra Cyn Ave Unit 306, Sherman Oaks, CA 91423 and is currently estimated at $820,368, approximately $446 per square foot. 4454 Vntra Cyn Ave Unit 306 is a home located in Los Angeles County with nearby schools including Ulysses S. Grant Senior High School, Dixie Canyon Avenue Elementary School, and Riverside Drive Charter Elementary School.
Ownership History
Date
Name
Owned For
Owner Type
Purchase Details
Closed on
Dec 1, 2023
Sold by
Poston Ryan and Akazawa Aimee
Bought by
Poston Family Trust and Poston
Current Estimated Value
Purchase Details
Closed on
Aug 9, 2016
Sold by
Somberg Bonnie
Bought by
Poston Ryan and Akazawa Aimee
Home Financials for this Owner
Home Financials are based on the most recent Mortgage that was taken out on this home.
Original Mortgage
$465,500
Interest Rate
3.45%
Mortgage Type
New Conventional
Purchase Details
Closed on
Dec 22, 1995
Sold by
Dulawa Kathryn
Bought by
Somberg Bonnie
Home Financials for this Owner
Home Financials are based on the most recent Mortgage that was taken out on this home.
Original Mortgage
$130,500
Interest Rate
7.18%
Purchase Details
Closed on
Oct 9, 1995
Sold by
Dulawa Kathryn
Bought by
Dulawa Leopoldo Begnigno and Dulawa Kathryn Estella
Create a Home Valuation Report for This Property
The Home Valuation Report is an in-depth analysis detailing your home's value as well as a comparison with similar homes in the area
Home Values in the Area
Average Home Value in this Area
Purchase History
| Date | Buyer | Sale Price | Title Company |
|---|---|---|---|
| Poston Family Trust | -- | None Listed On Document | |
| Poston Ryan | $495,000 | Progressive Title Company | |
| Somberg Bonnie | $145,000 | Equity Title | |
| Dulawa Leopoldo Begnigno | -- | -- |
Source: Public Records
Mortgage History
| Date | Status | Borrower | Loan Amount |
|---|---|---|---|
| Previous Owner | Poston Ryan | $465,500 | |
| Previous Owner | Somberg Bonnie | $130,500 |
Source: Public Records
Tax History Compared to Growth
Tax History
| Year | Tax Paid | Tax Assessment Tax Assessment Total Assessment is a certain percentage of the fair market value that is determined by local assessors to be the total taxable value of land and additions on the property. | Land | Improvement |
|---|---|---|---|---|
| 2025 | $6,969 | $574,484 | $342,370 | $232,114 |
| 2024 | $6,969 | $563,220 | $335,657 | $227,563 |
| 2023 | $6,835 | $552,177 | $329,076 | $223,101 |
| 2022 | $6,516 | $541,351 | $322,624 | $218,727 |
| 2021 | $6,430 | $530,738 | $316,299 | $214,439 |
| 2019 | $6,236 | $514,998 | $306,918 | $208,080 |
| 2018 | $6,205 | $504,900 | $300,900 | $204,000 |
| 2016 | $2,477 | $203,469 | $50,510 | $152,959 |
| 2015 | $2,441 | $200,414 | $49,752 | $150,662 |
| 2014 | $2,453 | $196,489 | $48,778 | $147,711 |
Source: Public Records
Map
Nearby Homes
- 4454 Ventura Canyon Ave Unit 105
- 4454 Ventura Canyon Ave Unit 304
- 36010 Ventura Canyon Ave
- 13543 Moorpark St Unit 7
- 4405 Ventura Canyon Ave
- 4381 Ventura Canyon Ave Unit 4
- 4545 Allott Ave
- 4477 Woodman Ave Unit 304
- 4546 Allott Ave
- 13453 Moorpark St
- 4358 Mammoth Ave Unit 26
- 13331 Moorpark St Unit 123
- 13331 Moorpark St Unit 206
- 4710 Ventura Canyon Ave
- 4226 Greenbush Ave
- 4321 Matilija Ave Unit 1
- 4321 Matilija Ave Unit 14
- 4216 Greenbush Ave
- 4455 Fulton Ave Unit 3
- 4637 Nagle Ave
- 4454 Ventura Canyon Ave Unit 308
- 4454 Ventura Canyon Ave Unit 301
- 4454 Ventura Canyon Ave Unit 207
- 4454 Ventura Canyon Ave
- 4454 Ventura Canyon Ave Unit 205
- 4454 Ventura Canyon Ave Unit 307
- 4454 Ventura Canyon Ave Unit 306
- 4454 Ventura Canyon Ave Unit 108
- 4454 Ventura Canyon Ave Unit 208
- 4454 Ventura Canyon Ave Unit 305
- 4454 Ventura Canyon Ave Unit 303
- 4454 Ventura Canyon Ave Unit 201
- 4454 Ventura Canyon Ave Unit 102
- 4454 Ventura Canyon Ave Unit 101
- 4454 Ventura Canyon Ave Unit 302
- 4454 Vntra Cyn Ave Unit 207
- 4454 Vntra Cyn Ave Unit 308
- 4454 Vntra Cyn Ave Unit 307
- 4454 Vntra Cyn Ave Unit 305
- 4454 Vntra Cyn Ave Unit 304