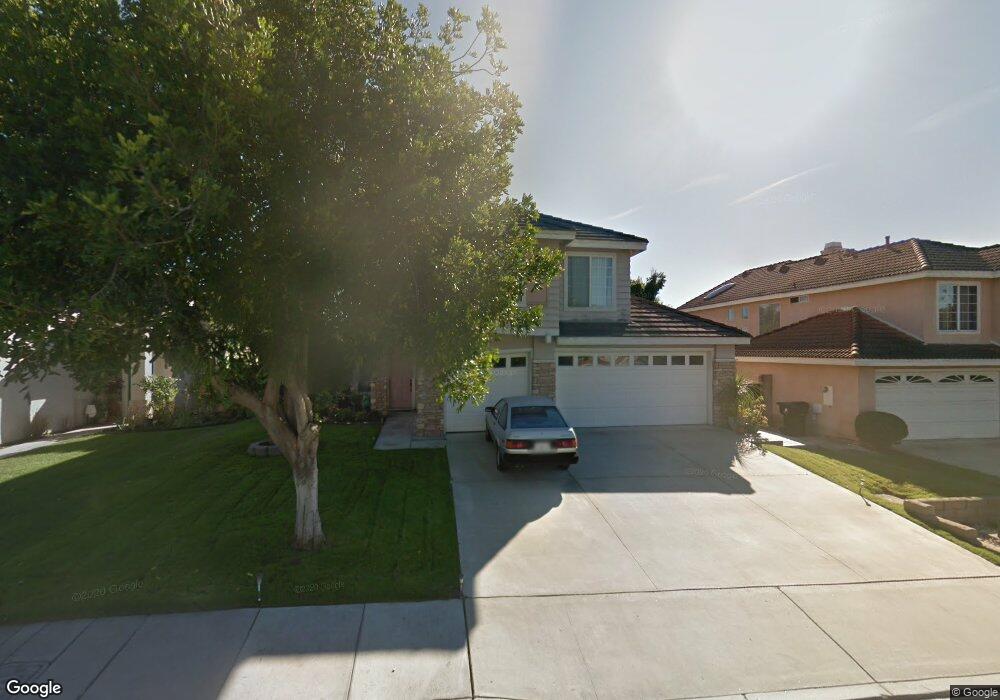
4455 Merle St Montclair, CA 91763
Estimated Value: $706,000 - $766,914
4
Beds
3
Baths
1,891
Sq Ft
$391/Sq Ft
Est. Value
About This Home
This home is located at 4455 Merle St, Montclair, CA 91763 and is currently estimated at $739,979, approximately $391 per square foot. 4455 Merle St is a home located in San Bernardino County with nearby schools including Ramona Elementary School, Oaks Middle, and Montclair High School.
Ownership History
Date
Name
Owned For
Owner Type
Purchase Details
Closed on
Oct 6, 2016
Sold by
Prachasaisoradej Sanuanphan A
Bought by
Prachasaisoradej Sanuanphan A and Suntalus Chanuwat
Current Estimated Value
Home Financials for this Owner
Home Financials are based on the most recent Mortgage that was taken out on this home.
Original Mortgage
$225,000
Outstanding Balance
$180,380
Interest Rate
3.46%
Mortgage Type
New Conventional
Estimated Equity
$559,599
Purchase Details
Closed on
Aug 30, 2001
Sold by
Sadiq Ahmed
Bought by
Suntalus Phan P
Home Financials for this Owner
Home Financials are based on the most recent Mortgage that was taken out on this home.
Original Mortgage
$143,200
Interest Rate
7%
Purchase Details
Closed on
May 9, 1995
Sold by
Sadig Ahmed
Bought by
Suntalus Phan P
Create a Home Valuation Report for This Property
The Home Valuation Report is an in-depth analysis detailing your home's value as well as a comparison with similar homes in the area
Home Values in the Area
Average Home Value in this Area
Purchase History
| Date | Buyer | Sale Price | Title Company |
|---|---|---|---|
| Prachasaisoradej Sanuanphan A | -- | Title 365 Company | |
| Suntalus Chanuwat | -- | Title 365 Company | |
| Suntalus Phan P | -- | Southland Title | |
| Suntalus Phan P | -- | -- |
Source: Public Records
Mortgage History
| Date | Status | Borrower | Loan Amount |
|---|---|---|---|
| Open | Prachasaisoradej Sanuanphan A | $225,000 | |
| Previous Owner | Suntalus Phan P | $143,200 |
Source: Public Records
Tax History Compared to Growth
Tax History
| Year | Tax Paid | Tax Assessment Tax Assessment Total Assessment is a certain percentage of the fair market value that is determined by local assessors to be the total taxable value of land and additions on the property. | Land | Improvement |
|---|---|---|---|---|
| 2025 | $3,574 | $331,934 | $99,686 | $232,248 |
| 2024 | $3,574 | $325,425 | $97,731 | $227,694 |
| 2023 | $3,474 | $319,044 | $95,815 | $223,229 |
| 2022 | $3,428 | $312,788 | $93,936 | $218,852 |
| 2021 | $3,407 | $306,655 | $92,094 | $214,561 |
| 2020 | $3,347 | $303,511 | $91,150 | $212,361 |
| 2019 | $3,318 | $297,560 | $89,363 | $208,197 |
| 2018 | $3,273 | $291,726 | $87,611 | $204,115 |
| 2017 | $3,155 | $286,006 | $85,893 | $200,113 |
| 2016 | $2,956 | $280,398 | $84,209 | $196,189 |
| 2015 | $2,935 | $276,186 | $82,944 | $193,242 |
| 2014 | $2,842 | $270,776 | $81,319 | $189,457 |
Source: Public Records
Map
Nearby Homes
- 4444 Merle St
- 4361 Mission Blvd Unit 116
- 4361 Mission Blvd Unit 100
- 4361 Mission Blvd Unit 121
- 4361 Mission Blvd Unit 80
- 11250 Ramona Ave
- 11250 Ramona Ave Unit 216
- 10991 Pipeline Ave
- 4814 Rawhide
- 3944 E 9th St
- 10484 Calico Ct
- 4587 Gold Rush Ct
- 11211 Chico Ave
- 11610 Sherwood Place
- 11620 Sherwood Place
- 11457 Brunswick Ln
- 4625 Avondale Ct
- Maddox Plan at Yorba Estates
- Malone Plan at Yorba Estates
- Madeline Plan at Yorba Estates
- 4461 Merle St
- 4443 Merle St
- 11066 Kimberly Ave
- 4473 Merle St
- 4441 Merle St
- 11076 Kimberly Ave
- 4452 Merle St
- 4448 Merle St
- 4464 Merle St
- 4477 Merle St
- 4429 Merle St
- 11073 San Pasqual Ave
- 11063 San Pasqual Ave
- 11065 Kimberly Ave
- 11025 San Pasqual Ave
- 4417 Merle St
- 4489 Merle St
- 4451 Rodeo St
- 11014 Kimberly Ave
- 11086 Kimberly Ave