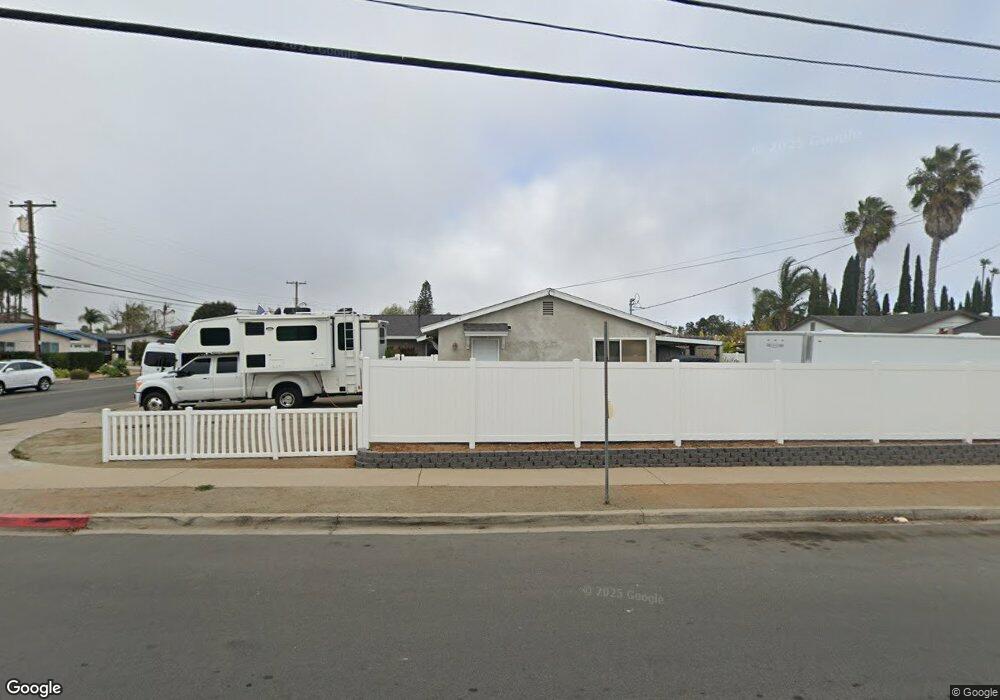
4455 Mount Herbert Ave San Diego, CA 92117
Clairemont Mesa West NeighborhoodEstimated Value: $1,050,836 - $1,174,000
3
Beds
2
Baths
1,188
Sq Ft
$948/Sq Ft
Est. Value
About This Home
This home is located at 4455 Mount Herbert Ave, San Diego, CA 92117 and is currently estimated at $1,126,209, approximately $947 per square foot. 4455 Mount Herbert Ave is a home located in San Diego County with nearby schools including Holmes Elementary, Marston Middle School, and Clairemont High School.
Ownership History
Date
Name
Owned For
Owner Type
Purchase Details
Closed on
Feb 26, 2021
Sold by
Gardella Rick and Gardella Jennifer
Bought by
Gardella Richard
Current Estimated Value
Home Financials for this Owner
Home Financials are based on the most recent Mortgage that was taken out on this home.
Original Mortgage
$531,000
Outstanding Balance
$476,246
Interest Rate
2.73%
Mortgage Type
New Conventional
Estimated Equity
$649,963
Purchase Details
Closed on
Jan 6, 2015
Sold by
Bwy Darren
Bought by
Gardella Rick and Gardella Jennifer
Home Financials for this Owner
Home Financials are based on the most recent Mortgage that was taken out on this home.
Original Mortgage
$52,500
Interest Rate
3.8%
Mortgage Type
Stand Alone Second
Purchase Details
Closed on
Jun 12, 2014
Sold by
Reynolds Teale
Bought by
Bwy Darren
Purchase Details
Closed on
May 27, 2014
Sold by
Owenby Melinda
Bought by
Bwy Darren
Create a Home Valuation Report for This Property
The Home Valuation Report is an in-depth analysis detailing your home's value as well as a comparison with similar homes in the area
Home Values in the Area
Average Home Value in this Area
Purchase History
| Date | Buyer | Sale Price | Title Company |
|---|---|---|---|
| Gardella Richard | -- | Amrock Inc | |
| Gardella Rick | $525,000 | Ticor Title | |
| Bwy Darren | -- | None Available | |
| Bwy Darren | $420,000 | First American Title Company |
Source: Public Records
Mortgage History
| Date | Status | Borrower | Loan Amount |
|---|---|---|---|
| Open | Gardella Richard | $531,000 | |
| Closed | Gardella Rick | $52,500 | |
| Closed | Gardella Rick | $420,000 |
Source: Public Records
Tax History
| Year | Tax Paid | Tax Assessment Tax Assessment Total Assessment is a certain percentage of the fair market value that is determined by local assessors to be the total taxable value of land and additions on the property. | Land | Improvement |
|---|---|---|---|---|
| 2025 | $7,546 | $630,962 | $570,873 | $60,089 |
| 2024 | $7,546 | $618,591 | $559,680 | $58,911 |
| 2023 | $7,378 | $606,462 | $548,706 | $57,756 |
| 2022 | $8,975 | $742,175 | $614,508 | $127,667 |
| 2021 | $7,129 | $582,914 | $527,400 | $55,514 |
| 2020 | $7,042 | $576,938 | $521,993 | $54,945 |
| 2019 | $6,915 | $565,626 | $511,758 | $53,868 |
| 2018 | $6,464 | $554,536 | $501,724 | $52,812 |
| 2017 | $6,309 | $543,664 | $491,887 | $51,777 |
| 2016 | $6,206 | $533,005 | $482,243 | $50,762 |
| 2015 | $4,963 | $420,000 | $380,000 | $40,000 |
| 2014 | $552 | $51,225 | $18,829 | $32,396 |
Source: Public Records
Map
Nearby Homes
- 4413 Mount Henry Ave
- 4595 Chateau Dr
- 4822 Mount la Palma Dr
- 4534 Chateau Dr
- 5017 Mount Gaywas Dr
- 4380 Rolfe Rd
- 4550 Diane Way
- 4597 Acoma Ave
- 4203 Tolowa St
- 4657 Chateau Place
- 4924 4930 Iroquois Ave
- 4774 Chickasaw Ct
- 5051 Canosa Ave
- 4161 Clairemont Mesa Blvd
- 4951 57 Genesee Ave
- 4862 Kings Way
- 5252 Balboa Arms Dr Unit 171
- 5252 Balboa Arms Dr Unit 120
- 3910 Hiawatha Way
- 4327-29 Clairemont Mesa Blvd
- 4465 Mount Herbert Ave
- 4618 Mount Etna Dr
- 4475 Mount Herbert Ave
- 4630 Mount Etna Dr
- 4466 Mount Herbert Ave
- 4460 Mount Herbert Ave
- 4472 Mount Herbert Ave
- 4485 Mount Herbert Ave
- 4454 Mount Herbert Ave
- 4644 Mount Etna Dr
- 4661 Mount Frissell Dr
- 4478 Mount Herbert Ave
- 4671 Mount Frissell Dr
- 4448 Mount Herbert Ave
- 4484 Mount Herbert Ave
- 4495 Mount Herbert Ave
- 4463 Mount Henry Ave
- 4658 Mount Etna Dr
- 4457 Mount Henry Ave
- 4469 Mount Henry Ave
Your Personal Tour Guide
Ask me questions while you tour the home.