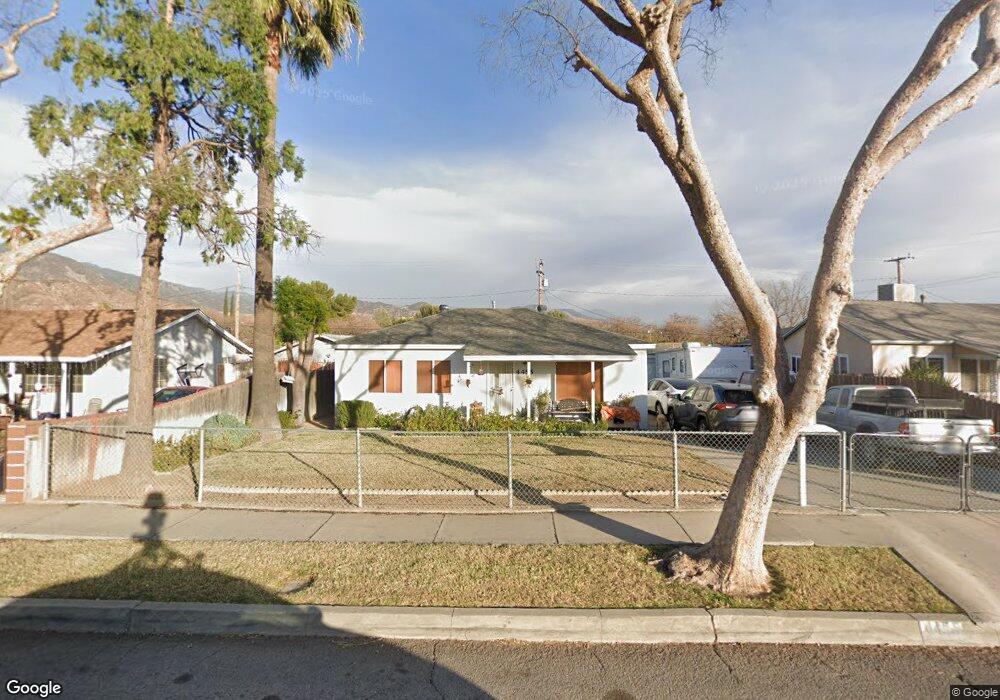
4455 N E St San Bernardino, CA 92407
Cajon NeighborhoodEstimated Value: $391,768 - $430,000
2
Beds
1
Bath
850
Sq Ft
$488/Sq Ft
Est. Value
About This Home
This home is located at 4455 N E St, San Bernardino, CA 92407 and is currently estimated at $414,942, approximately $488 per square foot. 4455 N E St is a home located in San Bernardino County with nearby schools including Hillside Elementary School, Shandin Hills Middle School, and Cajon High School.
Ownership History
Date
Name
Owned For
Owner Type
Purchase Details
Closed on
May 2, 1995
Sold by
Sturgis Shannon M
Bought by
Sturgis Richard H
Current Estimated Value
Home Financials for this Owner
Home Financials are based on the most recent Mortgage that was taken out on this home.
Original Mortgage
$71,850
Interest Rate
8.43%
Mortgage Type
FHA
Purchase Details
Closed on
Oct 24, 1994
Sold by
Hud
Bought by
Fitzpatrick Gary L
Purchase Details
Closed on
Oct 15, 1994
Sold by
Fitzpatrick Soonie
Bought by
Fitzpatrick Gary L
Purchase Details
Closed on
Feb 15, 1994
Sold by
Directors Mtg Loan Corp
Bought by
Hud
Purchase Details
Closed on
Oct 14, 1993
Sold by
Stan Shaw Corp
Bought by
Directors Mtg Loan Corp
Create a Home Valuation Report for This Property
The Home Valuation Report is an in-depth analysis detailing your home's value as well as a comparison with similar homes in the area
Home Values in the Area
Average Home Value in this Area
Purchase History
| Date | Buyer | Sale Price | Title Company |
|---|---|---|---|
| Sturgis Richard H | -- | Commonwealth Land Title Co | |
| Sturgis Richard H | $72,000 | Commonwealth Land Title Co | |
| Fitzpatrick Gary L | $44,000 | Fidelity National Title Ins | |
| Fitzpatrick Gary L | -- | Fidelity National Title Ins | |
| Hud | -- | United Title Company | |
| Directors Mtg Loan Corp | $99,601 | Stewart Title Co |
Source: Public Records
Mortgage History
| Date | Status | Borrower | Loan Amount |
|---|---|---|---|
| Closed | Sturgis Richard H | $71,850 |
Source: Public Records
Tax History
| Year | Tax Paid | Tax Assessment Tax Assessment Total Assessment is a certain percentage of the fair market value that is determined by local assessors to be the total taxable value of land and additions on the property. | Land | Improvement |
|---|---|---|---|---|
| 2025 | $1,600 | $120,769 | $40,314 | $80,455 |
| 2024 | $1,565 | $118,401 | $39,524 | $78,877 |
| 2023 | $1,523 | $116,079 | $38,749 | $77,330 |
| 2022 | $1,521 | $113,803 | $37,989 | $75,814 |
| 2021 | $1,519 | $111,571 | $37,244 | $74,327 |
| 2020 | $1,519 | $110,427 | $36,862 | $73,565 |
| 2019 | $1,475 | $108,262 | $36,139 | $72,123 |
| 2018 | $1,458 | $106,139 | $35,430 | $70,709 |
| 2017 | $1,411 | $104,058 | $34,735 | $69,323 |
| 2016 | $1,368 | $102,018 | $34,054 | $67,964 |
| 2015 | $1,241 | $100,485 | $33,542 | $66,943 |
| 2014 | $1,204 | $98,517 | $32,885 | $65,632 |
Source: Public Records
Map
Nearby Homes
- 4667 N Stoddard Ave
- 4906 N E St
- 4558 N Mountain View Ave
- 4965 N Crescent St
- 0 Cottage Dr Unit SW24192848
- 466 Edgerton Dr
- 279 W 39th St
- 4718 Woodbend Ln
- 449 Skylark Dr
- 3884 N Mountain View Ave
- 5249 N H St
- 5245 N Mountain View Ave
- 4196 N 3rd Ave
- 304 Edgerton Dr
- 235 E 43rd St
- 4004 N 3rd Ave
- 4255 N 3rd Ave
- 705 Dover Dr
- 3785 N Pershing Ave
- 5496 N E St
Your Personal Tour Guide
Ask me questions while you tour the home.