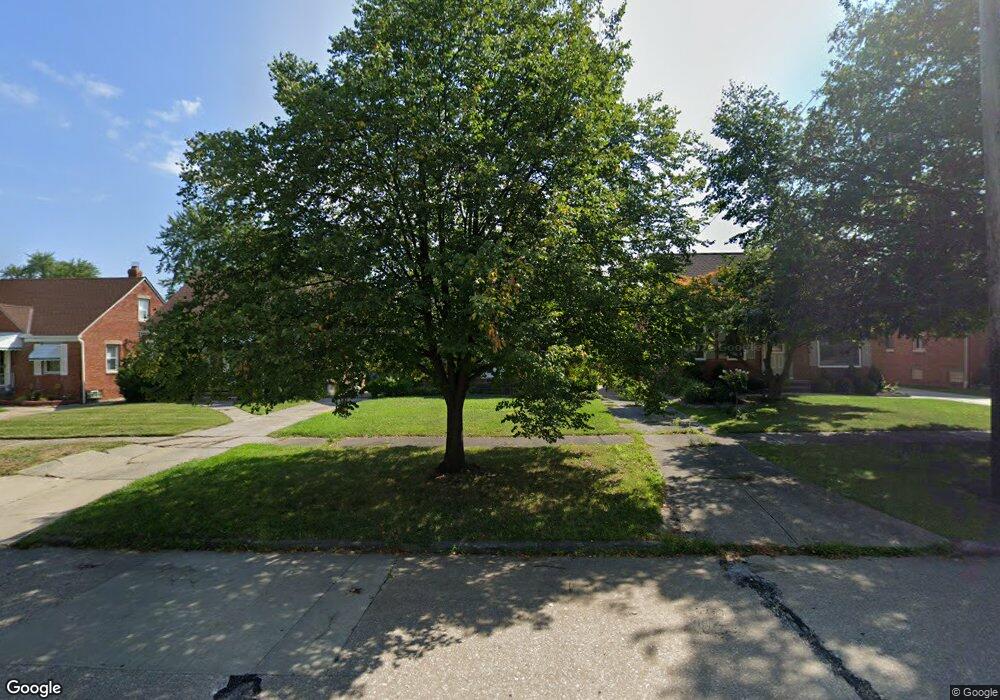
4455 W 57th St Cleveland, OH 44144
Old Brooklyn NeighborhoodEstimated Value: $146,427 - $160,000
2
Beds
1
Bath
754
Sq Ft
$200/Sq Ft
Est. Value
About This Home
This home is located at 4455 W 57th St, Cleveland, OH 44144 and is currently estimated at $151,107, approximately $200 per square foot. 4455 W 57th St is a home located in Cuyahoga County with nearby schools including Benjamin Franklin, Almira Academy, and Artemus Ward School.
Ownership History
Date
Name
Owned For
Owner Type
Purchase Details
Closed on
Feb 20, 2001
Sold by
Csornok Carol
Bought by
Hale Eric D
Current Estimated Value
Home Financials for this Owner
Home Financials are based on the most recent Mortgage that was taken out on this home.
Original Mortgage
$64,000
Outstanding Balance
$23,083
Interest Rate
7.06%
Estimated Equity
$128,024
Purchase Details
Closed on
Sep 30, 1997
Sold by
Csornok Paul D
Bought by
Csornok Richard A
Home Financials for this Owner
Home Financials are based on the most recent Mortgage that was taken out on this home.
Original Mortgage
$56,237
Interest Rate
7.63%
Mortgage Type
FHA
Purchase Details
Closed on
Jan 28, 1992
Sold by
Gruszczynski Julia
Bought by
Csornok Paul D
Purchase Details
Closed on
Oct 15, 1976
Sold by
Laule Bernard H
Bought by
Gruszczynski Julia
Purchase Details
Closed on
Apr 2, 1976
Sold by
Shumaker Stafford C
Bought by
Laule Bernard H
Purchase Details
Closed on
Jan 1, 1975
Bought by
Shumaker Stafford C
Create a Home Valuation Report for This Property
The Home Valuation Report is an in-depth analysis detailing your home's value as well as a comparison with similar homes in the area
Home Values in the Area
Average Home Value in this Area
Purchase History
| Date | Buyer | Sale Price | Title Company |
|---|---|---|---|
| Hale Eric D | $80,000 | -- | |
| Csornok Richard A | $75,000 | -- | |
| Csornok Paul D | $62,000 | -- | |
| Gruszczynski Julia | $33,000 | -- | |
| Laule Bernard H | $24,500 | -- | |
| Shumaker Stafford C | -- | -- |
Source: Public Records
Mortgage History
| Date | Status | Borrower | Loan Amount |
|---|---|---|---|
| Open | Hale Eric D | $64,000 | |
| Previous Owner | Csornok Richard A | $56,237 |
Source: Public Records
Tax History Compared to Growth
Tax History
| Year | Tax Paid | Tax Assessment Tax Assessment Total Assessment is a certain percentage of the fair market value that is determined by local assessors to be the total taxable value of land and additions on the property. | Land | Improvement |
|---|---|---|---|---|
| 2024 | $2,694 | $41,090 | $9,170 | $31,920 |
| 2023 | $2,228 | $29,370 | $6,580 | $22,790 |
| 2022 | $2,215 | $29,370 | $6,580 | $22,790 |
| 2021 | $2,193 | $29,370 | $6,580 | $22,790 |
| 2020 | $1,968 | $22,790 | $5,110 | $17,680 |
| 2019 | $1,820 | $65,100 | $14,600 | $50,500 |
| 2018 | $1,814 | $22,790 | $5,110 | $17,680 |
| 2017 | $1,787 | $21,670 | $4,450 | $17,220 |
| 2016 | $1,773 | $21,670 | $4,450 | $17,220 |
| 2015 | $1,978 | $21,670 | $4,450 | $17,220 |
| 2014 | $1,978 | $24,090 | $4,940 | $19,150 |
Source: Public Records
Map
Nearby Homes
- 4464 W 53rd St
- 4484 W 53rd St
- 4373 W 52nd St
- 4456 W 49th St
- 4427 W 49th St
- 5000 Behrwald Ave
- 5105 Behrwald Ave
- 4811 Ardmore Ave
- 4615 Ardmore Ave
- 5714 Stickney Ave
- 4520 Wichita Ave
- 4510 Woburn Ave
- 5701 Stickney Ave
- 4215 W 58th St
- 4329 Ardmore Ave
- 5902 Vandalia Ave
- 6015 Ira Ave
- 6904 & 6908 Southfield Ave
- 7420 Outlook Ave
- 6706 Woodhaven Ave