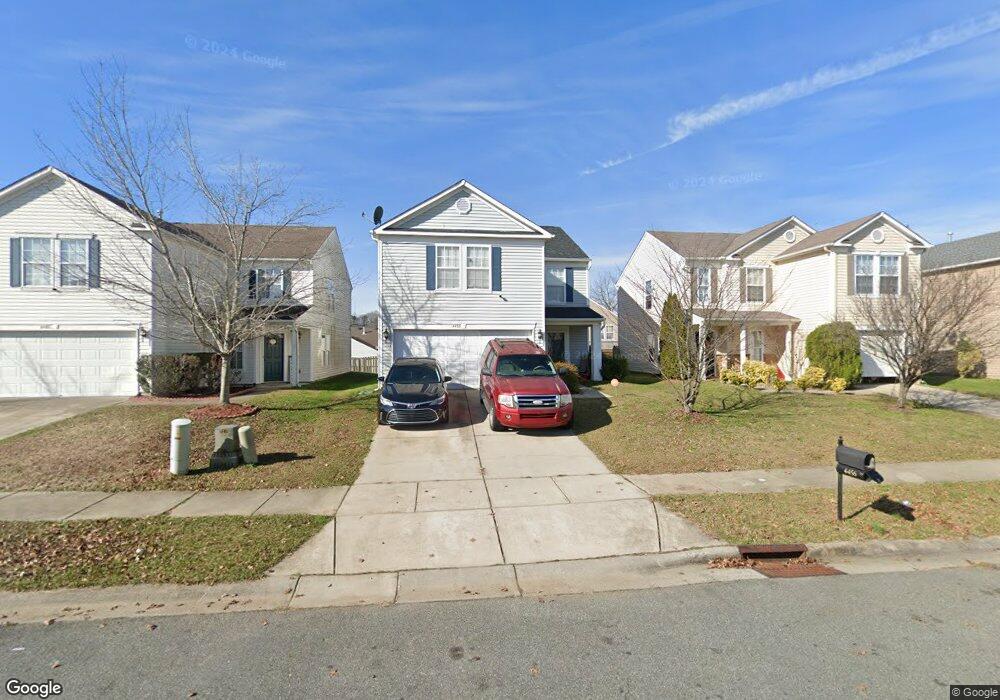
4456 Norfleet St Concord, NC 28025
Estimated Value: $313,000 - $326,000
3
Beds
3
Baths
2,037
Sq Ft
$156/Sq Ft
Est. Value
About This Home
This home is located at 4456 Norfleet St, Concord, NC 28025 and is currently estimated at $318,381, approximately $156 per square foot. 4456 Norfleet St is a home located in Cabarrus County with nearby schools including A.T. Allen Elementary School, C.C. Griffin Middle School, and Central Cabarrus High School.
Ownership History
Date
Name
Owned For
Owner Type
Purchase Details
Closed on
Mar 27, 2012
Sold by
Secretary Of Housing & Urban Development
Bought by
Hill Zedric
Current Estimated Value
Home Financials for this Owner
Home Financials are based on the most recent Mortgage that was taken out on this home.
Original Mortgage
$85,769
Outstanding Balance
$60,593
Interest Rate
4.4%
Mortgage Type
FHA
Estimated Equity
$257,788
Purchase Details
Closed on
Dec 15, 2011
Sold by
Kintner Kevin T and Kintner Lyndsey A
Bought by
Secretary Of Housing & Urban Development
Purchase Details
Closed on
Oct 21, 2005
Sold by
C P Morgan Communities Of Charlotte Llc
Bought by
Kintner Kevin T and Kintner Lyndsey A
Home Financials for this Owner
Home Financials are based on the most recent Mortgage that was taken out on this home.
Original Mortgage
$143,559
Interest Rate
5.66%
Mortgage Type
FHA
Create a Home Valuation Report for This Property
The Home Valuation Report is an in-depth analysis detailing your home's value as well as a comparison with similar homes in the area
Home Values in the Area
Average Home Value in this Area
Purchase History
| Date | Buyer | Sale Price | Title Company |
|---|---|---|---|
| Hill Zedric | -- | None Available | |
| Secretary Of Housing & Urban Development | $149,165 | None Available | |
| Kintner Kevin T | $146,000 | -- |
Source: Public Records
Mortgage History
| Date | Status | Borrower | Loan Amount |
|---|---|---|---|
| Open | Hill Zedric | $85,769 | |
| Previous Owner | Kintner Kevin T | $143,559 |
Source: Public Records
Tax History Compared to Growth
Tax History
| Year | Tax Paid | Tax Assessment Tax Assessment Total Assessment is a certain percentage of the fair market value that is determined by local assessors to be the total taxable value of land and additions on the property. | Land | Improvement |
|---|---|---|---|---|
| 2025 | $2,913 | $292,480 | $62,000 | $230,480 |
| 2024 | $2,913 | $292,480 | $62,000 | $230,480 |
| 2023 | $2,290 | $187,680 | $40,000 | $147,680 |
| 2022 | $2,290 | $187,680 | $40,000 | $147,680 |
| 2021 | $2,290 | $187,680 | $40,000 | $147,680 |
| 2020 | $2,290 | $187,680 | $40,000 | $147,680 |
| 2019 | $1,652 | $135,430 | $20,000 | $115,430 |
| 2018 | $1,625 | $135,430 | $20,000 | $115,430 |
| 2017 | $1,599 | $135,550 | $20,000 | $115,550 |
| 2016 | $949 | $132,100 | $21,000 | $111,100 |
| 2015 | $1,559 | $132,100 | $21,000 | $111,100 |
| 2014 | $1,559 | $132,100 | $21,000 | $111,100 |
Source: Public Records
Map
Nearby Homes
- 4425 Norfleet St
- 3931 Kellybrook Dr
- 4194 Clifftonville Ave SW
- 1051 Manston Place SW
- 4183 Broadstairs Dr
- 4175 Broadstairs Dr
- 1130 Brigadoon Ct
- 1009 Braxton Dr
- 1001 Loch Lomond Cir
- 668 Shellbark Dr
- 760 Bartram Ave Unit 114
- 4285 Long Arrow Dr
- 5248 Ellie Ct
- 5582 Flowes Store Rd
- 707 Pointe Andrews Dr SW
- 123 Softwind Ln
- 5707 Saint Adriens Way
- 876 Pointe Andrews Dr
- 137 Softwind Ln
- 4227 Kiser Woods Dr SW
- 4452 Norfleet St
- 4460 Norfleet St
- 4448 Norfleet St
- 4464 Norfleet St
- 4459 Saint Catherines Ct
- 4361 Saint Catherines Ct
- 4463 Saint Catherines Ct
- 4468 Norfleet St
- 4444 Norfleet St
- 4357 St Catherines Ct
- 4467 Saint Catherines Ct
- 4357 Saint Catherines Ct
- 4457 Norfleet St
- 4453 Norfleet St
- 4472 Norfleet St
- 4471 Saint Catherines Ct
- 4353 Saint Catherines Ct
- 4449 Norfleet St
- 4461 Norfleet St
- 4440 Norfleet St