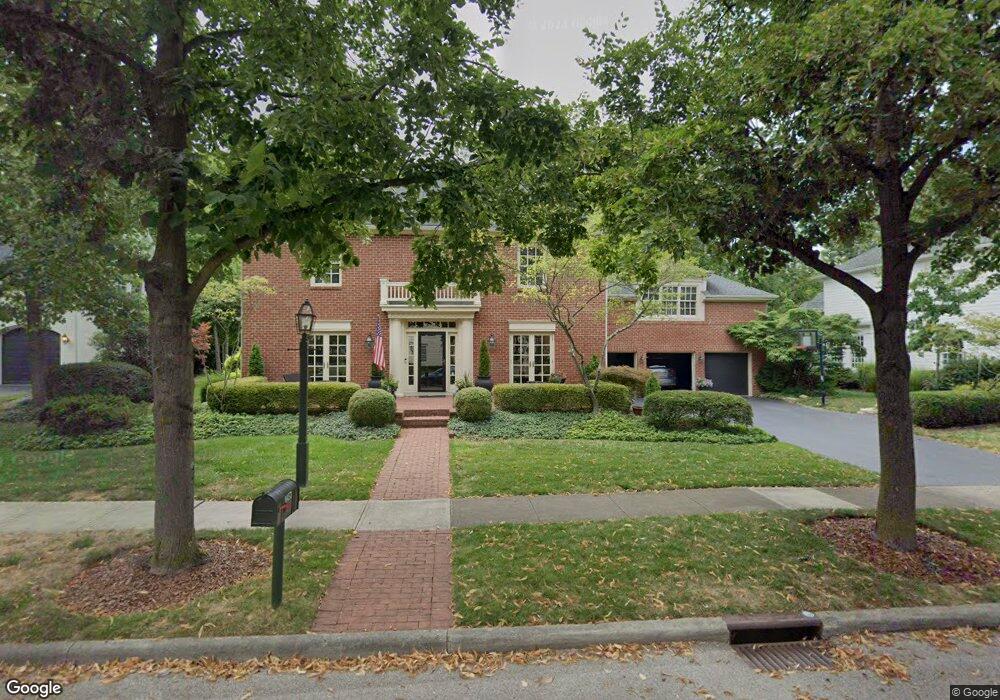
4457 Middle Aspinwall New Albany, OH 43054
Estimated Value: $1,097,000 - $1,364,000
4
Beds
6
Baths
4,004
Sq Ft
$311/Sq Ft
Est. Value
About This Home
This home is located at 4457 Middle Aspinwall, New Albany, OH 43054 and is currently estimated at $1,246,860, approximately $311 per square foot. 4457 Middle Aspinwall is a home located in Franklin County with nearby schools including New Albany Primary School, New Albany Intermediate School, and New Albany Middle School.
Ownership History
Date
Name
Owned For
Owner Type
Purchase Details
Closed on
Nov 16, 2018
Sold by
Brown James H and Brown Lora J
Bought by
Brown James H and Brown Lora J
Current Estimated Value
Purchase Details
Closed on
Jun 11, 1997
Sold by
Tuckerman Development Co
Bought by
Brown James H and Brown Lora J
Home Financials for this Owner
Home Financials are based on the most recent Mortgage that was taken out on this home.
Original Mortgage
$335,000
Outstanding Balance
$40,930
Interest Rate
6.25%
Estimated Equity
$1,205,930
Purchase Details
Closed on
Oct 24, 1996
Sold by
New Albany Co
Bought by
Tuckerman Dev Co
Create a Home Valuation Report for This Property
The Home Valuation Report is an in-depth analysis detailing your home's value as well as a comparison with similar homes in the area
Home Values in the Area
Average Home Value in this Area
Purchase History
| Date | Buyer | Sale Price | Title Company |
|---|---|---|---|
| Brown James H | -- | None Available | |
| Brown James H | $425,000 | Amerititle Agency Inc | |
| Tuckerman Dev Co | $95,000 | -- |
Source: Public Records
Mortgage History
| Date | Status | Borrower | Loan Amount |
|---|---|---|---|
| Open | Brown James H | $335,000 |
Source: Public Records
Tax History Compared to Growth
Tax History
| Year | Tax Paid | Tax Assessment Tax Assessment Total Assessment is a certain percentage of the fair market value that is determined by local assessors to be the total taxable value of land and additions on the property. | Land | Improvement |
|---|---|---|---|---|
| 2024 | $20,175 | $324,280 | $77,000 | $247,280 |
| 2023 | $19,070 | $324,275 | $77,000 | $247,275 |
| 2022 | $18,121 | $234,160 | $55,130 | $179,030 |
| 2021 | $17,440 | $234,160 | $55,130 | $179,030 |
| 2020 | $17,420 | $234,160 | $55,130 | $179,030 |
| 2019 | $18,114 | $222,670 | $52,500 | $170,170 |
| 2018 | $17,609 | $222,670 | $52,500 | $170,170 |
| 2017 | $17,693 | $222,670 | $52,500 | $170,170 |
| 2016 | $17,285 | $195,830 | $52,610 | $143,220 |
| 2015 | $17,318 | $195,830 | $52,610 | $143,220 |
| 2014 | $16,236 | $195,830 | $52,610 | $143,220 |
| 2013 | $8,355 | $186,480 | $50,085 | $136,395 |
Source: Public Records
Map
Nearby Homes
- 5950 Johnstown Rd
- 5945 Johnstown Rd
- 7 Richmond Square
- 14 Richmond Square
- 115 Keswick Dr
- 105 Keswick Dr
- 7362 Tottenham Place
- 6929 Clivdon Mews
- 4135 High Grove Crest
- 7030 Hanby's Loop
- 3637 Head of Pond Rd
- 7747 Sutton Place
- 6590 Wheatly Rd
- 4774 Bosk Dr
- 6813 Ridge Rock Dr Unit 14
- 6540 Wheatly Rd Unit LOT 701
- 3377 Abberley Dr Unit LOT 902
- 6544 Wheatly Rd Unit LOT 702
- 6439 Lake Mathias Dr
- 6834 Cedar Brook Glen
- 4445 Middle Aspinwall
- 4469 Middle Aspinwall
- 5888 Johnstown Rd
- 5840 Johnstown Rd
- 4466 Middle Aspinwall
- 4481 Middle Aspinwall
- 4433 Middle Aspinwall
- 4440 Middle Aspinwall
- 5892 Johnstown Rd
- 4480 Middle Aspinwall
- 4493 Middle Aspinwall
- 7645 Aspinwall S
- 4447 Olmsted Rd
- 4459 Olmsted Rd
- 4433 Olmsted Rd
- 5886 Johnstown Rd Unit 5888
- 7657 Aspinwall S
- 4479 Olmsted Rd
- 5896 Johnstown Rd
- 4407 Olmsted Rd