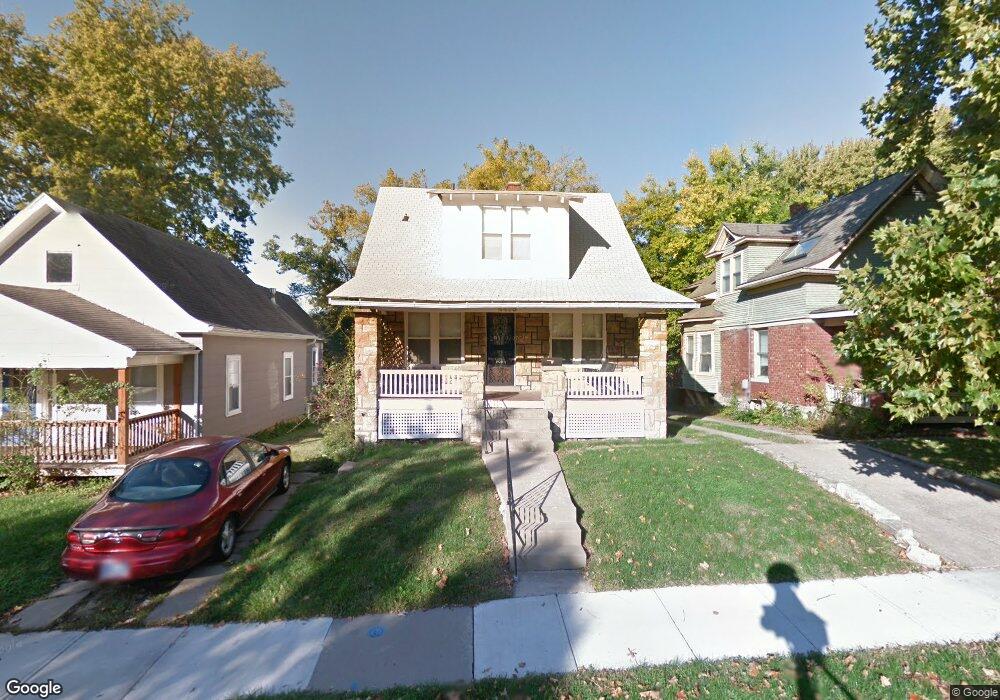
4458 Francis St Kansas City, KS 66103
Rosedale NeighborhoodEstimated Value: $305,000 - $327,000
3
Beds
1
Bath
1,594
Sq Ft
$195/Sq Ft
Est. Value
About This Home
This home is located at 4458 Francis St, Kansas City, KS 66103 and is currently estimated at $310,572, approximately $194 per square foot. 4458 Francis St is a home located in Wyandotte County with nearby schools including Frank Rushton Elementary School, Rosedale Middle, and J C Harmon High School.
Ownership History
Date
Name
Owned For
Owner Type
Purchase Details
Closed on
Nov 12, 2019
Sold by
Dan Thompson
Bought by
Lovelace Megan K
Current Estimated Value
Home Financials for this Owner
Home Financials are based on the most recent Mortgage that was taken out on this home.
Original Mortgage
$235,000
Outstanding Balance
$206,739
Interest Rate
3.6%
Mortgage Type
New Conventional
Estimated Equity
$103,833
Purchase Details
Closed on
Nov 7, 2019
Sold by
Thompson Dan
Bought by
Lovelace Megan K
Home Financials for this Owner
Home Financials are based on the most recent Mortgage that was taken out on this home.
Original Mortgage
$235,000
Outstanding Balance
$206,739
Interest Rate
3.6%
Mortgage Type
New Conventional
Estimated Equity
$103,833
Purchase Details
Closed on
Jul 17, 2019
Sold by
Ludwig Robin Ann and Ludwing Andrew R
Bought by
Thompson Dan
Home Financials for this Owner
Home Financials are based on the most recent Mortgage that was taken out on this home.
Original Mortgage
$199,000
Interest Rate
3.82%
Mortgage Type
Credit Line Revolving
Create a Home Valuation Report for This Property
The Home Valuation Report is an in-depth analysis detailing your home's value as well as a comparison with similar homes in the area
Home Values in the Area
Average Home Value in this Area
Purchase History
| Date | Buyer | Sale Price | Title Company |
|---|---|---|---|
| Lovelace Megan K | $312,550 | Continental Title | |
| Lovelace Megan K | -- | Continental Title Company | |
| Thompson Dan | -- | Platinum Title Llc |
Source: Public Records
Mortgage History
| Date | Status | Borrower | Loan Amount |
|---|---|---|---|
| Open | Lovelace Megan K | $235,000 | |
| Closed | Lovelace Megan K | $235,000 | |
| Previous Owner | Thompson Dan | $199,000 |
Source: Public Records
Tax History Compared to Growth
Tax History
| Year | Tax Paid | Tax Assessment Tax Assessment Total Assessment is a certain percentage of the fair market value that is determined by local assessors to be the total taxable value of land and additions on the property. | Land | Improvement |
|---|---|---|---|---|
| 2024 | $5,463 | $36,283 | $5,106 | $31,177 |
| 2023 | $5,053 | $31,315 | $4,797 | $26,518 |
| 2022 | $4,805 | $29,590 | $4,324 | $25,266 |
| 2021 | $4,580 | $27,611 | $4,188 | $23,423 |
| 2020 | $4,482 | $27,025 | $3,424 | $23,601 |
| 2019 | $3,168 | $19,193 | $3,291 | $15,902 |
| 2018 | $2,805 | $17,101 | $2,859 | $14,242 |
| 2017 | $2,685 | $16,239 | $2,859 | $13,380 |
| 2016 | $2,484 | $14,898 | $2,859 | $12,039 |
| 2015 | $2,415 | $14,326 | $2,859 | $11,467 |
| 2014 | $1,971 | $11,155 | $2,859 | $8,296 |
Source: Public Records
Map
Nearby Homes
- 4460 Francis St
- 4455 Eaton St
- 4417 Rainbow Blvd
- 4516 Rainbow Blvd
- 4431 Cambridge St
- 4524 Bell St
- 4530 Bell St
- 4407 Springfield St
- 2605 W 45th Ave
- 4605 State Line Rd
- 4526 Genessee St
- 1707 W 44th St
- 4330 Bell St
- 4206 Cambridge St
- 2207 W 47th Terrace
- 4621 Genessee St
- 2517 Essex Ave
- 1908 W 47th Terrace
- 4343 Lloyd St
- 4324 Fisher St
- 4456 Francis St
- 4454 Francis St
- 4462 Francis St
- 4452 Francis St
- 4450 Francis St
- 4469 Rainbow Blvd
- 4467 Rainbow Blvd
- 4467 Rainbow Blvd Unit D5
- 4455 Rainbow Blvd
- 4463 Rainbow Blvd
- 4463 Rainbow Blvd
- 4463 Rainbow Blvd
- 4465 Rainbow Blvd
- 4465 Rainbow Blvd
- 4461 Rainbow Blvd
- 4461 Rainbow Blvd
- 4471 Rainbow Blvd
- 4471 Rainbow Blvd
- 4459 Rainbow Blvd
- 4459 Rainbow Blvd