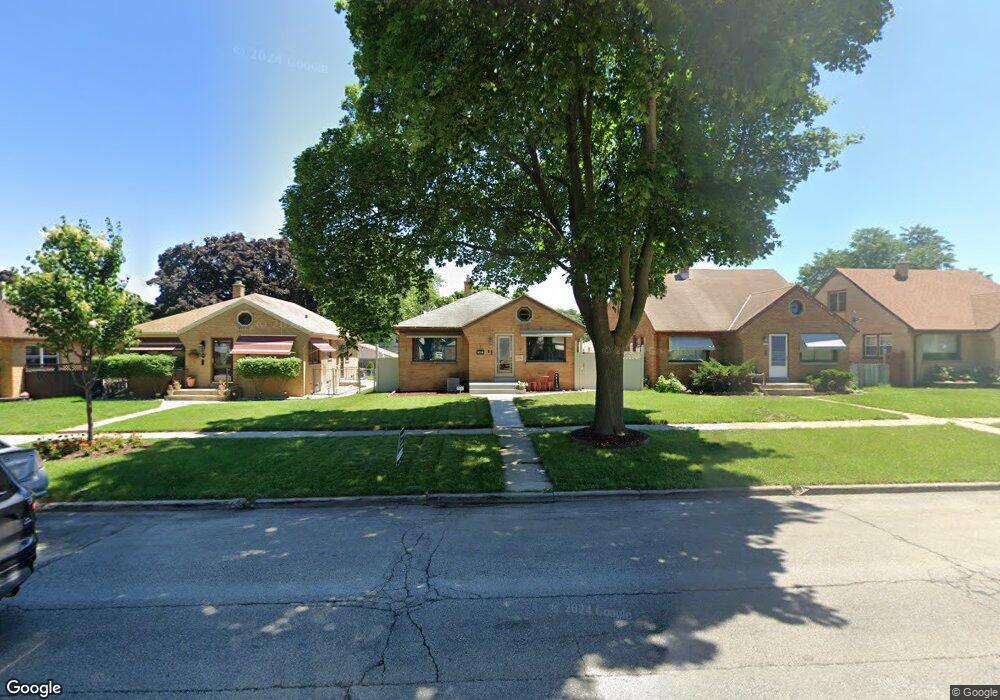
4458 N 68th St Milwaukee, WI 53218
Capitol Heights NeighborhoodEstimated Value: $162,000 - $191,000
2
Beds
1
Bath
1,026
Sq Ft
$169/Sq Ft
Est. Value
About This Home
This home is located at 4458 N 68th St, Milwaukee, WI 53218 and is currently estimated at $173,712, approximately $169 per square foot. 4458 N 68th St is a home located in Milwaukee County with nearby schools including Craig Montessori School, Milwaukee German Immersion School, and Milwaukee Spanish Immersion School - Upper Campus.
Ownership History
Date
Name
Owned For
Owner Type
Purchase Details
Closed on
Sep 18, 2007
Sold by
Hsbc Bank Usa
Bought by
Tyler Karen K
Current Estimated Value
Home Financials for this Owner
Home Financials are based on the most recent Mortgage that was taken out on this home.
Original Mortgage
$81,800
Outstanding Balance
$51,604
Interest Rate
6.5%
Mortgage Type
New Conventional
Estimated Equity
$122,108
Purchase Details
Closed on
Jun 13, 2007
Sold by
Busalacchi John
Bought by
Hsbc Bank Usa and Ace Securities Corp Home Equity Loan Tr
Purchase Details
Closed on
Dec 21, 2005
Sold by
Busalacchi John C
Bought by
Busalacchi John C and Busalacchi Dorothea A
Home Financials for this Owner
Home Financials are based on the most recent Mortgage that was taken out on this home.
Original Mortgage
$110,700
Interest Rate
10.75%
Mortgage Type
Stand Alone Refi Refinance Of Original Loan
Purchase Details
Closed on
Dec 23, 1999
Sold by
Busalacchi Walter F and Busalacchi Linda L
Bought by
Busalacchi John C
Home Financials for this Owner
Home Financials are based on the most recent Mortgage that was taken out on this home.
Original Mortgage
$44,778
Interest Rate
8.08%
Mortgage Type
FHA
Create a Home Valuation Report for This Property
The Home Valuation Report is an in-depth analysis detailing your home's value as well as a comparison with similar homes in the area
Home Values in the Area
Average Home Value in this Area
Purchase History
| Date | Buyer | Sale Price | Title Company |
|---|---|---|---|
| Tyler Karen K | $89,900 | None Available | |
| Hsbc Bank Usa | -- | None Available | |
| Busalacchi John C | -- | None Available | |
| Busalacchi John C | $45,300 | -- |
Source: Public Records
Mortgage History
| Date | Status | Borrower | Loan Amount |
|---|---|---|---|
| Open | Tyler Karen K | $81,800 | |
| Previous Owner | Busalacchi John C | $110,700 | |
| Previous Owner | Busalacchi John C | $44,778 |
Source: Public Records
Tax History Compared to Growth
Tax History
| Year | Tax Paid | Tax Assessment Tax Assessment Total Assessment is a certain percentage of the fair market value that is determined by local assessors to be the total taxable value of land and additions on the property. | Land | Improvement |
|---|---|---|---|---|
| 2024 | $4,909 | $147,900 | $11,900 | $136,000 |
| 2023 | $2,897 | $122,600 | $11,900 | $110,700 |
| 2022 | $2,604 | $122,600 | $11,900 | $110,700 |
| 2021 | $2,040 | $87,900 | $11,900 | $76,000 |
| 2020 | $3,148 | $87,900 | $11,900 | $76,000 |
| 2019 | $3,099 | $79,200 | $11,800 | $67,400 |
| 2018 | $3,390 | $79,200 | $11,800 | $67,400 |
| 2017 | $1,778 | $72,600 | $12,700 | $59,900 |
| 2016 | $2,136 | $71,600 | $12,700 | $58,900 |
| 2015 | $2,289 | $68,000 | $12,700 | $55,300 |
| 2014 | $1,822 | $68,000 | $12,700 | $55,300 |
| 2013 | -- | $68,000 | $12,700 | $55,300 |
Source: Public Records
Map
Nearby Homes
- 4513 N 67th St
- 4508 N 67th St
- 4539 N 68th St Unit 4541
- 4559 N 67th St
- 4437 N 65th St
- 4575 N 66th St
- 4541 N 65th St
- 4602 N 66th St
- 4440 N 64th St
- 4540 N 71st St
- 4325 N 70th St
- 6352 W Medford Ave
- 4683 N 68th St
- 6314 W Medford Ave
- 4441 N 62nd St Unit 4443
- 4407 N 62nd St
- 4416 N 62nd St
- 4319 N 72nd St
- 4375 N 61st St
- 6242 W Leon Terrace
- 4464 N 68th St
- 4452 N 68th St
- 4468 N 68th St
- 4446 N 68th St
- 4440 N 68th St
- 4474 N 68th St
- 4459 N 67th St
- 4453 N 67th St
- 4463 N 67th St
- 4447 N 67th St
- 4467 N 67th St
- 4480 N 68th St
- 4436 N 68th St
- 4443 N 67th St
- 4475 N 67th St
- 4459 N 68th St
- 4455 N 68th St
- 4463 N 68th St Unit 4465
- 4430 N 68th St
- 4437 N 67th St