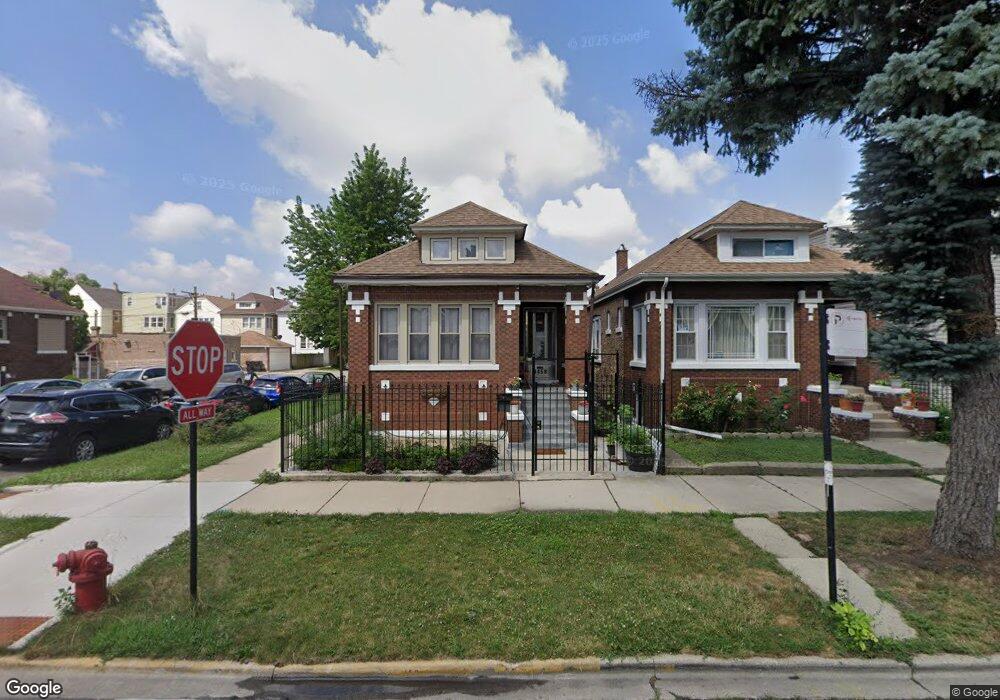
4458 S Mozart St Chicago, IL 60632
Brighton Park NeighborhoodEstimated Value: $238,000 - $298,000
4
Beds
3
Baths
1,001
Sq Ft
$274/Sq Ft
Est. Value
About This Home
This home is located at 4458 S Mozart St, Chicago, IL 60632 and is currently estimated at $274,467, approximately $274 per square foot. 4458 S Mozart St is a home located in Cook County with nearby schools including Columbia Explorers Elementary Academy, Kelly High School, and Acero - Brighton Park Elementary School.
Ownership History
Date
Name
Owned For
Owner Type
Purchase Details
Closed on
Jul 15, 2013
Sold by
Seem Group Llc
Bought by
Mei Lina and Zhu Bohao
Current Estimated Value
Home Financials for this Owner
Home Financials are based on the most recent Mortgage that was taken out on this home.
Original Mortgage
$73,000
Outstanding Balance
$55,421
Interest Rate
5%
Mortgage Type
Adjustable Rate Mortgage/ARM
Estimated Equity
$219,046
Purchase Details
Closed on
Oct 3, 2012
Sold by
Chaidez Aureliano
Bought by
Se Em Group Llc
Purchase Details
Closed on
Oct 31, 2000
Sold by
Maciulis Robert A
Bought by
Chaidez Aureliano and Chaidez Gloria
Home Financials for this Owner
Home Financials are based on the most recent Mortgage that was taken out on this home.
Original Mortgage
$122,700
Interest Rate
7.87%
Mortgage Type
FHA
Create a Home Valuation Report for This Property
The Home Valuation Report is an in-depth analysis detailing your home's value as well as a comparison with similar homes in the area
Home Values in the Area
Average Home Value in this Area
Purchase History
| Date | Buyer | Sale Price | Title Company |
|---|---|---|---|
| Mei Lina | $111,500 | Chicago Title Insurance Comp | |
| Se Em Group Llc | $41,500 | None Available | |
| Chaidez Aureliano | $130,000 | Stewart Title |
Source: Public Records
Mortgage History
| Date | Status | Borrower | Loan Amount |
|---|---|---|---|
| Open | Mei Lina | $73,000 | |
| Previous Owner | Chaidez Aureliano | $122,700 |
Source: Public Records
Tax History Compared to Growth
Tax History
| Year | Tax Paid | Tax Assessment Tax Assessment Total Assessment is a certain percentage of the fair market value that is determined by local assessors to be the total taxable value of land and additions on the property. | Land | Improvement |
|---|---|---|---|---|
| 2024 | $2,606 | $22,001 | $3,623 | $18,378 |
| 2023 | $3,223 | $15,601 | $2,898 | $12,703 |
| 2022 | $3,223 | $19,000 | $2,898 | $16,102 |
| 2021 | $3,151 | $19,000 | $2,898 | $16,102 |
| 2020 | $2,106 | $12,496 | $2,898 | $9,598 |
| 2019 | $2,178 | $14,201 | $2,898 | $11,303 |
| 2018 | $2,140 | $14,201 | $2,898 | $11,303 |
| 2017 | $2,259 | $13,801 | $2,608 | $11,193 |
| 2016 | $2,279 | $13,801 | $2,608 | $11,193 |
| 2015 | $2,063 | $13,801 | $2,608 | $11,193 |
| 2014 | $2,371 | $12,678 | $2,463 | $10,215 |
| 2013 | $1,842 | $12,678 | $2,463 | $10,215 |
Source: Public Records
Map
Nearby Homes
- 4331 S California Ave
- 4557 S Francisco Ave
- 4605 S Fairfield Ave
- 4554 S Washtenaw Ave
- 2719 W Pope John Paul ii Dr
- 4426 S Albany Ave
- 4759 S Rockwell St
- 4756 S Rockwell St
- 4754 S Rockwell St
- 4415 S Rockwell St
- 4132 S Mozart St
- 4609 S Rockwell St
- 4759 S Maplewood Ave
- 4757 S Maplewood Ave
- 4756 S Maplewood Ave
- 3742 S Albany Ave
- 4417 S Campbell Ave
- 3150 W 42nd Place
- 3137 W 42nd St
- 4149 S Rockwell St
- 4454 S Mozart St
- 4452 S Mozart St
- 4450 S Mozart St
- 4500 S Mozart St
- 4446 S Mozart St
- 4502 S Mozart St
- 4444 S Mozart St
- 4459 S Francisco Ave
- 4506 S Mozart St
- 4442 S Mozart St
- 4508 S Mozart St
- 4508 S Mozart St Unit 2
- 4440 S Mozart St Unit 2
- 4453 S Francisco Ave
- 4501 S Mozart St
- 4501 S Mozart St
- 4510 S Mozart St
- 4457 S Mozart St
- 4449 S Francisco Ave Unit 1
- 4449 S Francisco Ave