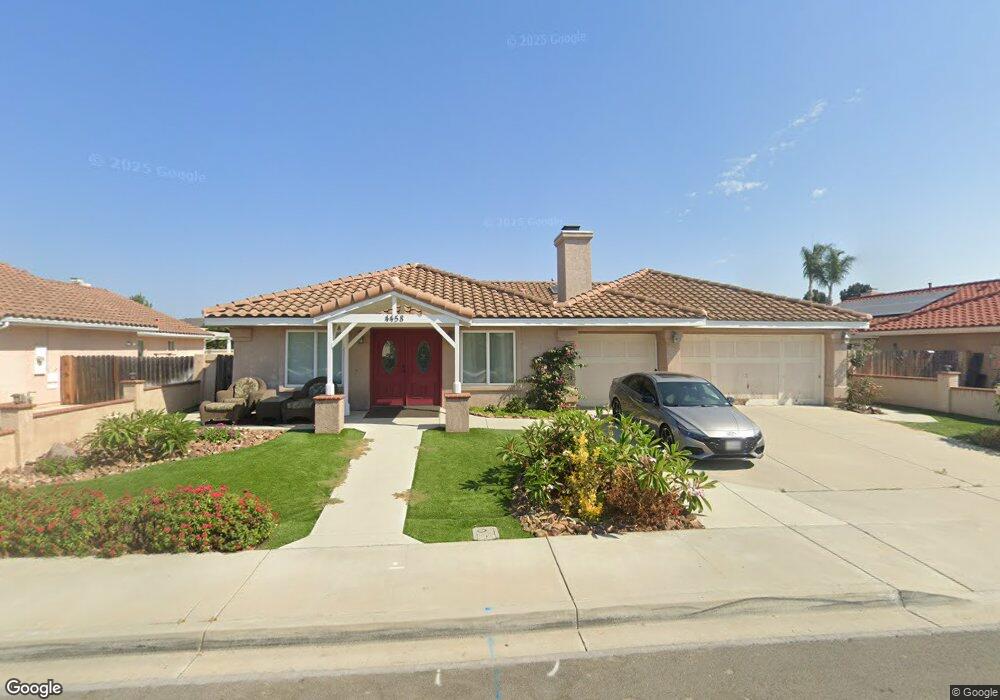
4458 San Joaquin St Oceanside, CA 92057
North Valley NeighborhoodEstimated Value: $1,074,000 - $1,171,000
4
Beds
4
Baths
2,707
Sq Ft
$410/Sq Ft
Est. Value
About This Home
This home is located at 4458 San Joaquin St, Oceanside, CA 92057 and is currently estimated at $1,110,315, approximately $410 per square foot. 4458 San Joaquin St is a home located in San Diego County with nearby schools including Libby Elementary School, Martin Luther King Jr. Middle School, and El Camino High School.
Ownership History
Date
Name
Owned For
Owner Type
Purchase Details
Closed on
Apr 9, 2014
Sold by
Weaver Mindi D
Bought by
Weaver Kevin
Current Estimated Value
Home Financials for this Owner
Home Financials are based on the most recent Mortgage that was taken out on this home.
Original Mortgage
$215,000
Outstanding Balance
$163,317
Interest Rate
4.32%
Mortgage Type
New Conventional
Estimated Equity
$946,998
Purchase Details
Closed on
Sep 14, 1998
Sold by
Tisdale Charles S
Bought by
Weaver Kevin A and Weaver Mindi D
Home Financials for this Owner
Home Financials are based on the most recent Mortgage that was taken out on this home.
Original Mortgage
$144,000
Interest Rate
6.88%
Purchase Details
Closed on
Jun 14, 1995
Sold by
Beazer Homes California Inc
Bought by
Tisdale Charles S and Tisdale Jacqueline L
Home Financials for this Owner
Home Financials are based on the most recent Mortgage that was taken out on this home.
Original Mortgage
$170,000
Interest Rate
7.62%
Mortgage Type
Assumption
Create a Home Valuation Report for This Property
The Home Valuation Report is an in-depth analysis detailing your home's value as well as a comparison with similar homes in the area
Home Values in the Area
Average Home Value in this Area
Purchase History
| Date | Buyer | Sale Price | Title Company |
|---|---|---|---|
| Weaver Kevin | -- | Chicago Title Company | |
| Weaver Kevin A | $180,000 | Lawyerstitle | |
| Tisdale Charles S | -- | Lawyers Title | |
| Tisdale Charles S | $170,000 | First American Title |
Source: Public Records
Mortgage History
| Date | Status | Borrower | Loan Amount |
|---|---|---|---|
| Open | Weaver Kevin | $215,000 | |
| Closed | Weaver Kevin A | $144,000 | |
| Previous Owner | Tisdale Charles S | $170,000 | |
| Closed | Weaver Kevin A | $18,000 |
Source: Public Records
Tax History Compared to Growth
Tax History
| Year | Tax Paid | Tax Assessment Tax Assessment Total Assessment is a certain percentage of the fair market value that is determined by local assessors to be the total taxable value of land and additions on the property. | Land | Improvement |
|---|---|---|---|---|
| 2025 | $5,110 | $458,034 | $66,383 | $391,651 |
| 2024 | $5,110 | $449,054 | $65,082 | $383,972 |
| 2023 | $4,953 | $440,250 | $63,806 | $376,444 |
| 2022 | $4,876 | $431,618 | $62,555 | $369,063 |
| 2021 | $4,891 | $423,156 | $61,329 | $361,827 |
| 2020 | $4,741 | $418,818 | $60,701 | $358,117 |
| 2019 | $4,603 | $410,607 | $59,511 | $351,096 |
| 2018 | $4,552 | $402,557 | $58,345 | $344,212 |
| 2017 | $71 | $394,664 | $57,201 | $337,463 |
| 2016 | $4,322 | $386,927 | $56,080 | $330,847 |
| 2015 | $4,197 | $381,116 | $55,238 | $325,878 |
| 2014 | $4,036 | $373,651 | $54,156 | $319,495 |
Source: Public Records
Map
Nearby Homes
- 4418 Jill St
- 27 Avenida Descanso
- 213 Festival Dr
- 194 Avenida Descanso Unit H
- 195 Avenida Descanso Unit 121
- 175 Avenida Descanso Unit 106
- 4466 Saint Andrews Place
- 4425 Arbor Cove Cir
- 625 Sumner Way Unit 4
- 625 Sumner Way Unit 2
- 4616 N River Rd Unit 61
- 231 Riverview Way
- 638 Sumner Way Unit 2
- 4470 Brisbane Way Unit 1
- 4660 N River Rd Unit 17
- 4660 N River Rd Unit 150
- 0 N River Rd Unit NDP2507519
- 4560 Calle Del Palo
- 4413 Point Degada
- 853 Dana Point Way
- 4460 San Joaquin St
- 4456 San Joaquin St
- 4462 San Joaquin St
- 4454 San Joaquin St
- 4459 San Joaquin St
- 4452 San Joaquin St
- 4464 San Joaquin St
- 4457 San Joaquin St
- 4461 San Joaquin St
- 4411 Jill St
- 4408 Jill St
- 4455 San Joaquin St
- 4463 San Joaquin St
- 4413 Jill St
- 4450 San Joaquin St
- 4466 San Joaquin St
- 4453 San Joaquin St
- 4465 San Joaquin St
- 171 Festival Dr
- 4515 Inverness Dr