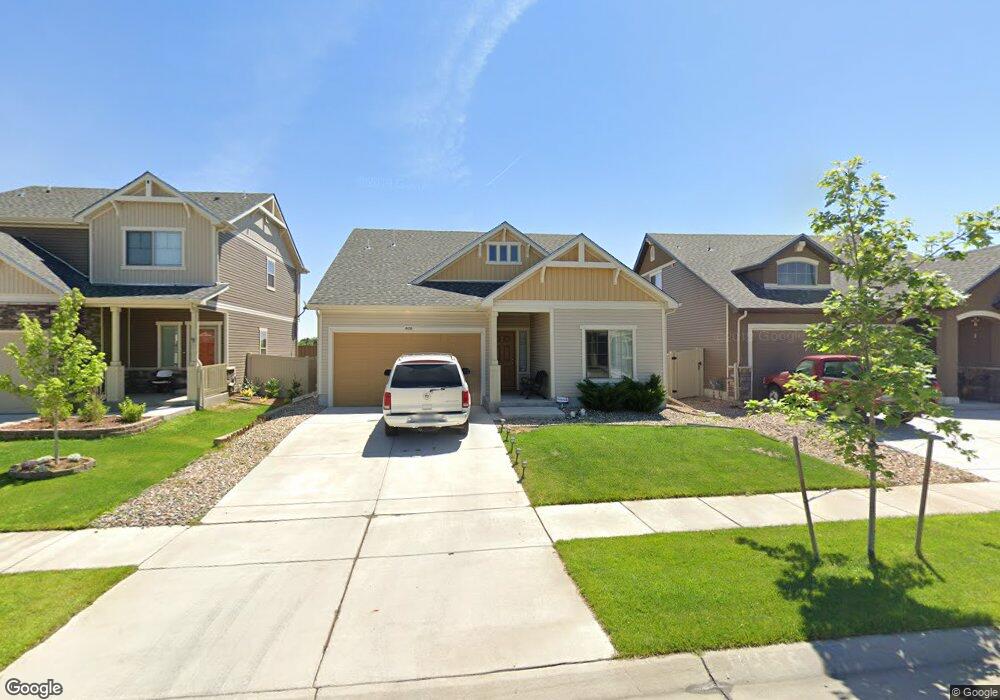
4458 Walden Way Denver, CO 80249
Gateway NeighborhoodEstimated Value: $434,000 - $554,000
2
Beds
2
Baths
2,100
Sq Ft
$236/Sq Ft
Est. Value
About This Home
This home is located at 4458 Walden Way, Denver, CO 80249 and is currently estimated at $496,579, approximately $236 per square foot. 4458 Walden Way is a home located in Denver County with nearby schools including Pitt-Waller K-8 School, McGlone Academy, and Marie L. Greenwood Academy.
Ownership History
Date
Name
Owned For
Owner Type
Purchase Details
Closed on
May 15, 2024
Sold by
Peoples Kendra
Bought by
Sanchez Jose Ascension and Flores Andres Sanchez
Current Estimated Value
Home Financials for this Owner
Home Financials are based on the most recent Mortgage that was taken out on this home.
Original Mortgage
$472,883
Outstanding Balance
$466,176
Interest Rate
6.82%
Mortgage Type
FHA
Estimated Equity
$30,403
Purchase Details
Closed on
Feb 2, 2022
Sold by
Collins Sr William A
Bought by
Peoples Kendra
Home Financials for this Owner
Home Financials are based on the most recent Mortgage that was taken out on this home.
Original Mortgage
$476,215
Interest Rate
3.45%
Mortgage Type
FHA
Purchase Details
Closed on
Jul 22, 2015
Sold by
Oakwood Homes Llc
Bought by
Collins William A and Collins Angela S
Home Financials for this Owner
Home Financials are based on the most recent Mortgage that was taken out on this home.
Original Mortgage
$246,453
Interest Rate
4.08%
Mortgage Type
FHA
Create a Home Valuation Report for This Property
The Home Valuation Report is an in-depth analysis detailing your home's value as well as a comparison with similar homes in the area
Home Values in the Area
Average Home Value in this Area
Purchase History
| Date | Buyer | Sale Price | Title Company |
|---|---|---|---|
| Sanchez Jose Ascension | $487,500 | Land Title | |
| Peoples Kendra | $485,000 | New Title Company Name | |
| Collins William A | $251,478 | Town & Country Title Svcs Ll |
Source: Public Records
Mortgage History
| Date | Status | Borrower | Loan Amount |
|---|---|---|---|
| Open | Sanchez Jose Ascension | $472,883 | |
| Previous Owner | Peoples Kendra | $476,215 | |
| Previous Owner | Collins William A | $246,453 |
Source: Public Records
Tax History Compared to Growth
Tax History
| Year | Tax Paid | Tax Assessment Tax Assessment Total Assessment is a certain percentage of the fair market value that is determined by local assessors to be the total taxable value of land and additions on the property. | Land | Improvement |
|---|---|---|---|---|
| 2024 | $4,184 | $32,700 | $2,670 | $30,030 |
| 2023 | $4,027 | $32,700 | $2,670 | $30,030 |
| 2022 | $3,513 | $26,390 | $5,940 | $20,450 |
| 2021 | $3,245 | $27,150 | $6,110 | $21,040 |
| 2020 | $3,453 | $26,060 | $6,110 | $19,950 |
| 2019 | $3,399 | $26,060 | $6,110 | $19,950 |
| 2018 | $2,957 | $21,840 | $2,740 | $19,100 |
| 2017 | $3,669 | $21,840 | $2,740 | $19,100 |
| 2016 | $3,323 | $20,070 | $772 | $19,298 |
| 2015 | $456 | $2,810 | $2,810 | $0 |
| 2014 | $692 | $4,380 | $4,380 | $0 |
Source: Public Records
Map
Nearby Homes
- 18258 E 45th Place
- 18108 E 44th Ave
- 4424 Andes St
- 4528 Andes St
- 18661 Mitchell Place
- 4565 Andes St
- 4361 Argonne St
- 4215 Andes Ct
- 4325 Argonne St
- 18636 E 42nd Ave
- 4716 Andes St
- 18875 E 43rd Ave
- 18890 E 43rd Ave
- 18944 E 44th Ave
- 4580 Argonne St
- 19075 E 45th Ave
- 4313 Ceylon St
- 4620 Argonne St
- 5033 N Walden Way
- 4545 Ensenada St
- 4458 Walden Way
- 4448 Walden Way
- 4478 Walden Way
- 4438 Walden Way
- 4488 Walden Way
- 4428 Walden Way
- 4437 Walden Way
- 4427 Walden Way
- 4447 Walden Way
- 4498 Walden Way
- 4418 Walden Way
- 4457 Walden Way
- 4497 Walden Way
- 4408 Walden Way
- 18269 E 44th Ave
- 4446 Walden Ct
- 4436 Walden Ct
- 4456 Walden Ct
- 4426 Walden Ct
- 18268 E 44th Ave