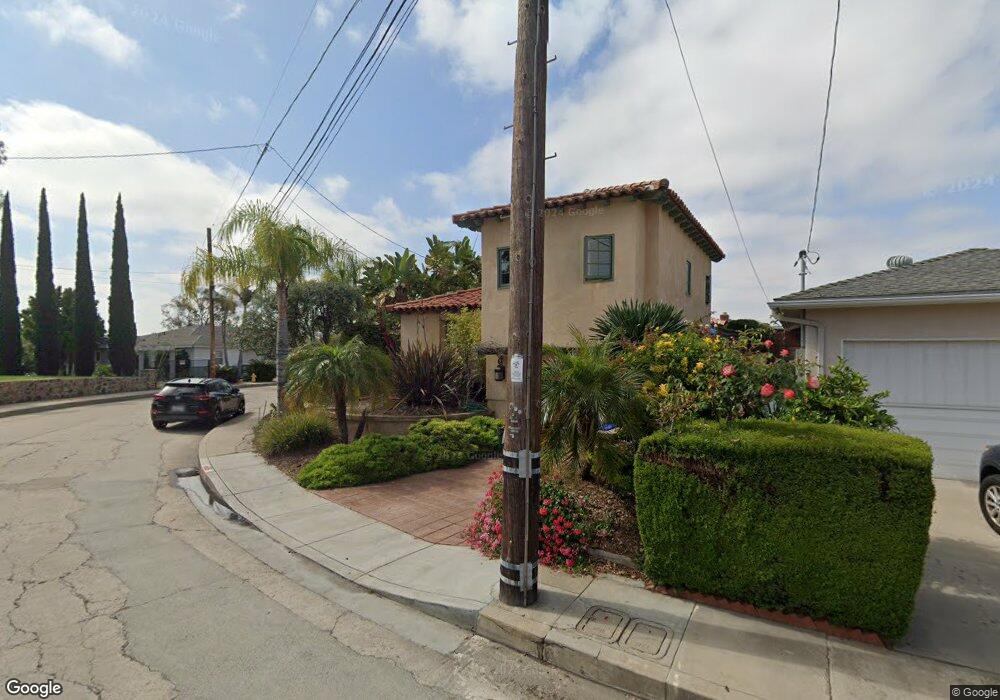
4459 Braeburn Rd San Diego, CA 92116
Kensington NeighborhoodEstimated Value: $1,456,020 - $1,782,000
3
Beds
2
Baths
1,510
Sq Ft
$1,052/Sq Ft
Est. Value
About This Home
This home is located at 4459 Braeburn Rd, San Diego, CA 92116 and is currently estimated at $1,589,005, approximately $1,052 per square foot. 4459 Braeburn Rd is a home located in San Diego County with nearby schools including Franklin Elementary School, Wilson Middle School, and Lewis Middle School.
Ownership History
Date
Name
Owned For
Owner Type
Purchase Details
Closed on
Apr 11, 2006
Sold by
Lauck Dennis and Lauck Beverly
Bought by
Beverly Ann Lauck & Dennis Dean Lauck Re
Current Estimated Value
Purchase Details
Closed on
Jul 28, 2002
Sold by
Loarie Christopher Thomas and Loarie Shannon Kline
Bought by
Lauck Dennis and Lauck Beverly
Home Financials for this Owner
Home Financials are based on the most recent Mortgage that was taken out on this home.
Original Mortgage
$159,000
Interest Rate
5.56%
Purchase Details
Closed on
Sep 29, 1998
Sold by
Margaret Mccracken and Margaret David H
Bought by
Loarie Christopher Thomas and Loarie Shannon Kline
Home Financials for this Owner
Home Financials are based on the most recent Mortgage that was taken out on this home.
Original Mortgage
$247,950
Interest Rate
6.88%
Purchase Details
Closed on
Apr 28, 1989
Create a Home Valuation Report for This Property
The Home Valuation Report is an in-depth analysis detailing your home's value as well as a comparison with similar homes in the area
Home Values in the Area
Average Home Value in this Area
Purchase History
| Date | Buyer | Sale Price | Title Company |
|---|---|---|---|
| Beverly Ann Lauck & Dennis Dean Lauck Re | -- | None Available | |
| Lauck Dennis | $489,000 | -- | |
| Loarie Christopher Thomas | $261,000 | First American Title Ins Co | |
| -- | $212,000 | -- |
Source: Public Records
Mortgage History
| Date | Status | Borrower | Loan Amount |
|---|---|---|---|
| Previous Owner | Lauck Dennis | $159,000 | |
| Previous Owner | Loarie Christopher Thomas | $247,950 |
Source: Public Records
Tax History Compared to Growth
Tax History
| Year | Tax Paid | Tax Assessment Tax Assessment Total Assessment is a certain percentage of the fair market value that is determined by local assessors to be the total taxable value of land and additions on the property. | Land | Improvement |
|---|---|---|---|---|
| 2025 | $9,697 | $799,767 | $362,075 | $437,692 |
| 2024 | $9,697 | $784,086 | $354,976 | $429,110 |
| 2023 | $9,479 | $768,713 | $348,016 | $420,697 |
| 2022 | $9,220 | $753,642 | $341,193 | $412,449 |
| 2021 | $9,150 | $738,865 | $334,503 | $404,362 |
| 2020 | $9,038 | $731,290 | $331,074 | $400,216 |
| 2019 | $8,875 | $716,952 | $324,583 | $392,369 |
| 2018 | $8,299 | $702,895 | $318,219 | $384,676 |
| 2017 | $8,100 | $689,114 | $311,980 | $377,134 |
| 2016 | $7,969 | $675,603 | $305,863 | $369,740 |
| 2015 | $7,849 | $665,456 | $301,269 | $364,187 |
| 2014 | $7,725 | $652,422 | $295,368 | $357,054 |
Source: Public Records
Map
Nearby Homes
- 4417 Braeburn Rd
- 5150 Bristol Rd
- 5216 Caminito Solitario
- 4336 Caminito de la Escena
- 4223 Middlesex Dr
- 4386 Argos Dr
- 4192 Rochester Rd
- 4613 Janet Place
- 4205 Caminito Pintoresco
- 4664 Yerba Santa Dr
- 5050 Marlborough Dr (-70)
- 4306 Aldine Dr Unit 1 to 6, 1 to 3 total
- 4354 N Talmadge Dr
- 4386 Adams Ave
- 4860 Marlborough Dr
- 4931 Lorraine Dr
- 4349 Adams Ave
- 4706 Norma Dr
- 4768 Caroline Dr
- 4136 Palisades Rd
- 4435 Braeburn Rd
- 4429 Braeburn Rd
- 4465 Braeburn Rd
- 4470 Braeburn Rd
- 4440 Braeburn Rd
- 4423 Braeburn Rd
- 4460 Braeburn Rd
- 4471 Braeburn Rd
- 4434 Braeburn Rd
- 4420 Braeburn Rd
- 4426 Braeburn Rd
- 4411 Braeburn Rd
- 4418 Braeburn Rd
- 4407 Braeburn Rd
- 4408 Braeburn Rd
- 4401 Braeburn Rd
- 4353 Hilldale Rd
- 4402 Braeburn Rd
- 412 Hillale Rd
- 4375 Hilldale Rd