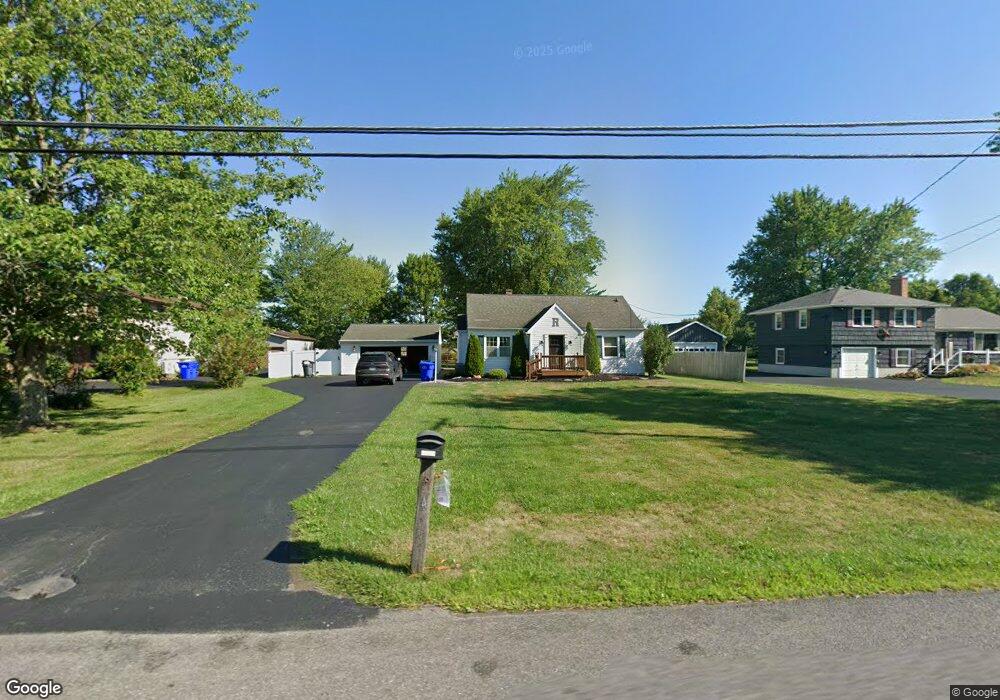
4459 Mapleton Rd Lockport, NY 14094
Estimated Value: $238,000 - $308,000
3
Beds
1
Bath
948
Sq Ft
$291/Sq Ft
Est. Value
About This Home
This home is located at 4459 Mapleton Rd, Lockport, NY 14094 and is currently estimated at $275,856, approximately $290 per square foot. 4459 Mapleton Rd is a home located in Niagara County with nearby schools including Fricano Primary School, Regan Intermediate School, and Starpoint Middle School.
Ownership History
Date
Name
Owned For
Owner Type
Purchase Details
Closed on
May 7, 2009
Sold by
Rollain Frederick J and Rollain Susan C
Bought by
Rollain Frederick R and Rollain Stacey L
Current Estimated Value
Home Financials for this Owner
Home Financials are based on the most recent Mortgage that was taken out on this home.
Original Mortgage
$14,016
Outstanding Balance
$8,879
Interest Rate
4.9%
Mortgage Type
New Conventional
Estimated Equity
$266,977
Purchase Details
Closed on
Jun 2, 2006
Sold by
Sirva Relocation Llc
Bought by
Rollain Frederick
Home Financials for this Owner
Home Financials are based on the most recent Mortgage that was taken out on this home.
Original Mortgage
$89,600
Interest Rate
6.17%
Mortgage Type
New Conventional
Purchase Details
Closed on
Mar 15, 2001
Sold by
Peterson George E
Bought by
Adkins Randy G
Purchase Details
Closed on
Oct 26, 1994
Sold by
Vanevery Helen P
Bought by
Peterson Peterson
Create a Home Valuation Report for This Property
The Home Valuation Report is an in-depth analysis detailing your home's value as well as a comparison with similar homes in the area
Home Values in the Area
Average Home Value in this Area
Purchase History
| Date | Buyer | Sale Price | Title Company |
|---|---|---|---|
| Rollain Frederick R | $37,116 | None Available | |
| Rollain Frederick | $112,000 | Allen Miskell | |
| Adkins Randy G | $80,000 | David Blackmon | |
| Peterson Peterson | $70,000 | -- |
Source: Public Records
Mortgage History
| Date | Status | Borrower | Loan Amount |
|---|---|---|---|
| Open | Rollain Frederick R | $14,016 | |
| Previous Owner | Rollain Frederick | $89,600 |
Source: Public Records
Tax History
| Year | Tax Paid | Tax Assessment Tax Assessment Total Assessment is a certain percentage of the fair market value that is determined by local assessors to be the total taxable value of land and additions on the property. | Land | Improvement |
|---|---|---|---|---|
| 2024 | $4,498 | $115,000 | $19,000 | $96,000 |
| 2023 | $4,615 | $115,000 | $19,000 | $96,000 |
| 2022 | $4,406 | $115,000 | $19,000 | $96,000 |
| 2021 | $4,469 | $115,000 | $19,000 | $96,000 |
| 2020 | $3,939 | $115,000 | $19,000 | $96,000 |
| 2019 | $3,620 | $115,000 | $19,000 | $96,000 |
| 2018 | $3,692 | $115,000 | $19,000 | $96,000 |
| 2017 | $3,620 | $115,000 | $19,000 | $96,000 |
| 2016 | $3,558 | $115,000 | $19,000 | $96,000 |
| 2015 | -- | $115,000 | $19,000 | $96,000 |
| 2014 | -- | $115,000 | $19,000 | $96,000 |
Source: Public Records
Map
Nearby Homes
- 6040 Aiken Rd
- V/L 6721 Aiken Rd
- 4283 Lockport Rd
- 4788 Mapleton Rd
- 4797 Beach Ridge Rd
- 6082 Townline Rd
- 5830 Diller Rd
- 3849 Mapleton Rd
- 3959 Wheatfield Crossing
- 6721 Aiken Rd
- 3947 Wheatfield Crossing
- 6107 Shawnee Rd
- 3894 Wheatfield Crossing Rd
- 3863 Ridgeland Dr
- 3839 Ridgeland Dr
- 3918 Wheatfield Crossing
- 3936 Wheatfield Crossing
- 5831 Shawnee Rd
- 6727 Campbell Blvd
- 5848 Shawnee Rd
- 4453 Mapleton Rd
- 4465 Mapleton Rd
- 4447 Mapleton Rd
- 4471 Mapleton Rd
- 6220 Aiken Rd
- 6200 Aiken Rd
- 4433 Mapleton Rd
- 4446 Mapleton Rd
- 6170 Aiken Rd
- 6262 Aiken Rd
- 4434 Mapleton Rd
- 4423 Mapleton Rd
- 6270 Aiken Rd
- 4529 Mapleton Rd
- 4422 Mapleton Rd
- 4417 Mapleton Rd
- 6259 Aiken Rd
- 6156 Aiken Rd
- 6286 Aiken Rd
- 4416 Mapleton Rd
Your Personal Tour Guide
Ask me questions while you tour the home.