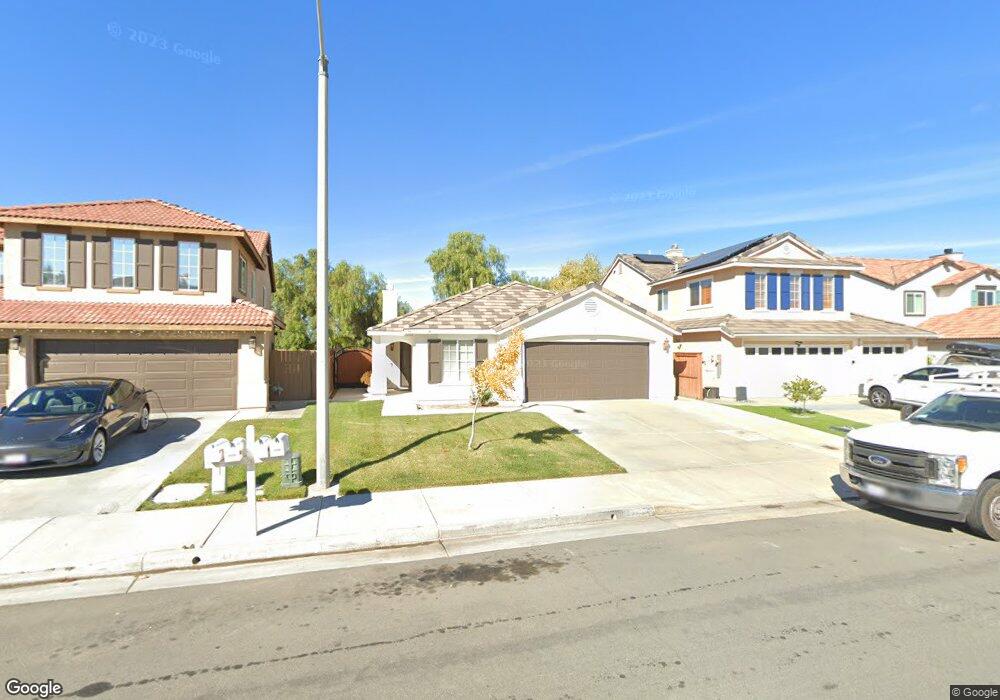
44599 Brentwood Place Temecula, CA 92592
Vail Ranch NeighborhoodEstimated Value: $625,000 - $681,000
3
Beds
2
Baths
1,454
Sq Ft
$445/Sq Ft
Est. Value
About This Home
This home is located at 44599 Brentwood Place, Temecula, CA 92592 and is currently estimated at $646,950, approximately $444 per square foot. 44599 Brentwood Place is a home located in Riverside County with nearby schools including Pauba Valley Elementary School, Vail Ranch Middle School, and Great Oak High School.
Ownership History
Date
Name
Owned For
Owner Type
Purchase Details
Closed on
Apr 24, 2025
Sold by
Solano Jose Carlos
Bought by
Jose Carlos Solano Trust and Solano
Current Estimated Value
Purchase Details
Closed on
Jun 17, 2021
Sold by
Cortes Fernando and Cortes Martha
Bought by
Solano Jose Carlos
Home Financials for this Owner
Home Financials are based on the most recent Mortgage that was taken out on this home.
Original Mortgage
$365,000
Interest Rate
2.9%
Mortgage Type
New Conventional
Purchase Details
Closed on
Jun 9, 2021
Sold by
Solano Miriam J
Bought by
Solano Jose Carlos
Home Financials for this Owner
Home Financials are based on the most recent Mortgage that was taken out on this home.
Original Mortgage
$365,000
Interest Rate
2.9%
Mortgage Type
New Conventional
Purchase Details
Closed on
Jun 21, 2016
Sold by
Jimenez Selene
Bought by
Solano Jose Carlos
Home Financials for this Owner
Home Financials are based on the most recent Mortgage that was taken out on this home.
Original Mortgage
$324,022
Interest Rate
3.5%
Mortgage Type
FHA
Purchase Details
Closed on
May 11, 2016
Sold by
Tongco Dianne
Bought by
Solano Jose Carlos and Cortes Fernando
Home Financials for this Owner
Home Financials are based on the most recent Mortgage that was taken out on this home.
Original Mortgage
$324,022
Interest Rate
3.5%
Mortgage Type
FHA
Purchase Details
Closed on
Oct 24, 2003
Sold by
Tongco Dianne and Tongco Diann
Bought by
Tongco Dianne
Home Financials for this Owner
Home Financials are based on the most recent Mortgage that was taken out on this home.
Original Mortgage
$249,000
Interest Rate
6.6%
Mortgage Type
Purchase Money Mortgage
Purchase Details
Closed on
Jun 12, 2002
Sold by
Tongco Victor
Bought by
Tongco Diann
Home Financials for this Owner
Home Financials are based on the most recent Mortgage that was taken out on this home.
Original Mortgage
$186,400
Interest Rate
6.75%
Purchase Details
Closed on
May 28, 2002
Sold by
Morrow Sean J and Ritchey Kelley J
Bought by
Tongco Diann
Home Financials for this Owner
Home Financials are based on the most recent Mortgage that was taken out on this home.
Original Mortgage
$186,400
Interest Rate
6.75%
Purchase Details
Closed on
Jan 18, 2000
Sold by
Richmond American Homes Of Calif
Bought by
Morrow Sean J and Ritchey Kelley J
Home Financials for this Owner
Home Financials are based on the most recent Mortgage that was taken out on this home.
Original Mortgage
$176,050
Interest Rate
8.53%
Create a Home Valuation Report for This Property
The Home Valuation Report is an in-depth analysis detailing your home's value as well as a comparison with similar homes in the area
Home Values in the Area
Average Home Value in this Area
Purchase History
| Date | Buyer | Sale Price | Title Company |
|---|---|---|---|
| Jose Carlos Solano Trust | -- | None Listed On Document | |
| Solano Jose Carlos | -- | Clearmark Title Company | |
| Solano Jose Carlos | -- | Clearmark Title | |
| Solano Jose Carlos | -- | Title 365 | |
| Solano Jose Carlos | $330,000 | Title 365 | |
| Tongco Dianne | -- | United Title Company | |
| Tongco Diann | -- | New Century Title Company | |
| Tongco Diann | $233,000 | New Century Title Company | |
| Morrow Sean J | $185,500 | First American Title Co |
Source: Public Records
Mortgage History
| Date | Status | Borrower | Loan Amount |
|---|---|---|---|
| Previous Owner | Solano Jose Carlos | $365,000 | |
| Previous Owner | Solano Jose Carlos | $324,022 | |
| Previous Owner | Tongco Dianne | $249,000 | |
| Previous Owner | Tongco Diann | $186,400 | |
| Previous Owner | Morrow Sean J | $176,050 |
Source: Public Records
Tax History Compared to Growth
Tax History
| Year | Tax Paid | Tax Assessment Tax Assessment Total Assessment is a certain percentage of the fair market value that is determined by local assessors to be the total taxable value of land and additions on the property. | Land | Improvement |
|---|---|---|---|---|
| 2025 | $6,200 | $512,656 | $140,479 | $372,177 |
| 2023 | $6,200 | $492,751 | $135,025 | $357,726 |
| 2022 | $6,012 | $483,090 | $132,378 | $350,712 |
| 2021 | $4,653 | $360,900 | $109,361 | $251,539 |
| 2020 | $4,595 | $357,200 | $108,240 | $248,960 |
| 2019 | $4,535 | $350,197 | $106,118 | $244,079 |
| 2018 | $4,446 | $343,332 | $104,040 | $239,292 |
| 2017 | $4,367 | $336,600 | $102,000 | $234,600 |
| 2016 | $3,743 | $290,751 | $81,106 | $209,645 |
| 2015 | $3,677 | $286,386 | $79,889 | $206,497 |
| 2014 | $3,567 | $280,778 | $78,325 | $202,453 |
Source: Public Records
Map
Nearby Homes
- 44607 Crestwood Cir
- 33422 Scarborough Ln
- 44690 Calle Lopez
- 33432 Winston Way Unit C
- 44738 Corte Gutierrez
- 44364 Kingston Dr
- 33763 Abbey Rd
- 33919 Galleron St
- 33827 Flora Springs St
- 33888 Madrigal Ct
- 33564 Blue Water Way
- 44822 Camino Alamosa
- 33429 Barrington Dr
- 45250 Oakville Ct
- 34036 Galleron St
- 34078 Amici St
- 34116 Galleron St
- 44260 Nighthawk Pass
- 32908 Freesia Way
- 43912 Country Ridge Ct
- 44593 Brentwood Place
- 44605 Brentwood Place
- 44587 Brentwood Place
- 44611 Brentwood Place
- 44596 Camino Gonzales
- 44602 Camino Gonzales
- 44590 Camino Gonzales
- 44581 Brentwood Place
- 44617 Brentwood Place
- 44608 Camino Gonzales
- 44614 Camino Gonzales
- 44598 Brentwood Place
- 44606 Brentwood Place
- 44575 Brentwood Place
- 44623 Brentwood Place
- 44584 Camino Gonzales
- 44620 Camino Gonzales
- 33528 Rosewood Cir
- 44622 Brentwood Place